
Marine GPS System User Manual

4-6
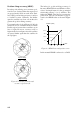
Difference between FURUNO and
NAVIONICS charts
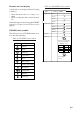
Table 4-4 Comparison of chart systems
metIONURUFSCINOIVAN
gnillorcstoD
ytilibapac
SEYSEY
pu-esruoC
yalpsid
SEYON
atadesuohthgiL
noitatneserp
3*SEYSEY
rosructamooZ
noitisop
SEY1*
taegnaR
rotauqE
,2,5.1,1
,6,5,4,3
,8
2918...21
mn
,52.0,521.0
,4,3,2,1,5.0
mn4201...8
tesffotrahC
yrtneatad
SEYON
gniretneCSEY2*
*1 NAVIONICS chart may not center cursor
perfectly.
*2 NAVIONICS chart may not center own
ship’s position perfectly.
*3 Newly designed chart cards containing
lighthouse data. Chart cards for North
America area are completed, and others
are in production.
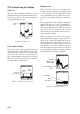
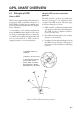
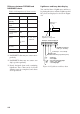
Lighthouse and buoy data display
You can find data of lighthouses and buoys
by placing the cursor on them. Lighthouse and
buoy data are displayed as shown in Figure
4-9.
FL 12S 27M
Place the cursor on
a lighthouse or buoy mark.
Lighthouse or
buoy data
FL(2) G 12S 15M
Number of flashes per period (ex.:2)
Period (ex.: 12 seconds)
Visibility in nautical
mile (ex.: 15 miles)
FL : Flashing
F : Fixed light
F FL : Fixed and Flashing light
MO : Morse code light
Oc : Occulting light
Light color
Example of data displayed
Figure 4-9 Lighthouse and buoy data