
User Manual


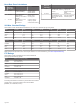


Table Of Contents
- Table of Contents
- Introduction
- Training
- Heart Rate Features
- Viewing the Heart Rate Widget
- Setting Your Heart Rate Zones
- Broadcasting Heart Rate Data to Garmin® Devices
- Running Dynamics
- Physiological Measurements
- Activity Tracking
- Smart Features
- History
- Navigation
- ANT+ Sensors
- Customizing Your Device
- Setting Up Your User Profile
- Activity Profiles
- Activity Settings
- Activity Tracking Settings
- System Settings
- Device Information
- Troubleshooting
- Support and Updates
- Getting More Information
- Acquiring Satellite Signals
- Improving GPS Satellite Reception
- Resetting the Device
- Clearing User Data
- Restoring All Default Settings
- Viewing Device Information
- Updating the Software
- Maximizing Battery Life
- My daily step count does not appear
- My device does not beep in cold weather
- Appendix
- Index

Heart Rate Zone Calculations
Zone % of
Maximum
Heart Rate
Perceived Exertion Benefits
1 50–60% Relaxed, easy pace,
rhythmic breathing
Beginning-level
aerobic training,
reduces stress
2 60–70% Comfortable pace,
slightly deeper
breathing, conversation
possible
Basic cardiovascular
training, good
recovery pace
3 70–80% Moderate pace, more
difficult to hold
conversation
Improved aerobic
capacity, optimal
cardiovascular training
Zone % of
Maximum
Heart Rate
Perceived Exertion Benefits
4 80–90% Fast pace and a bit
uncomfortable, breathing
forceful
Improved anaerobic
capacity and
threshold, improved
speed
5 90–100% Sprinting pace,
unsustainable for long
period of time, labored
breathing
Anaerobic and
muscular endurance,
increased power
VO2 Max. Standard Ratings
These tables include standardized classifications for VO2 max. estimates by age and gender.
Males Percentile 20–29 30–39 40–49 50–59 60–69 70–79
Superior 95 55.4 54 52.5 48.9 45.7 42.1
Excellent 80 51.1 48.3 46.4 43.4 39.5 36.7
Good 60 45.4 44 42.4 39.2 35.5 32.3
Fair 40 41.7 40.5 38.5 35.6 32.3 29.4
Poor 0–40 <41.7 <40.5 <38.5 <35.6 <32.3 <29.4
Females Percentile 20–29 30–39 40–49 50–59 60–69 70–79
Superior 95 49.6 47.4 45.3 41.1 37.8 36.7
Excellent 80 43.9 42.4 39.7 36.7 33 30.9
Good 60 39.5 37.8 36.3 33 30 28.1
Fair 40 36.1 34.4 33 30.1 27.5 25.9
Poor 0–40 <36.1 <34.4 <33 <30.1 <27.5 <25.9
Data reprinted with permission from The Cooper Institute. For more information, go to www.CooperInstitute.org.
FTP Ratings
These tables include classifications for functional threshold
power (FTP) estimates by gender.
Males Watts per Kilogram (W/kg)
Superior 5.05 and greater
Excellent From 3.93 to 5.04
Good From 2.79 to 3.92
Fair From 2.23 to 2.78
Untrained Less than 2.23
Females Watts per Kilogram (W/kg)
Superior 4.30 and greater
Excellent From 3.33 to 4.29
Good From 2.36 to 3.32
Fair From 1.90 to 2.35
Untrained Less than 1.90
FTP ratings are based on research by Hunter Allen and Andrew
Coggan, PhD, Training and Racing with a Power Meter
(Boulder, CO: VeloPress, 2010).
Appendix 23