
User's Manual
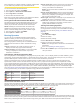


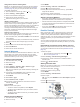
Table Of Contents
- Table of Contents
- Introduction
- Solar Charging
- Activities and Apps
- Starting an Activity
- Stopping an Activity
- Adding or Removing a Favorite Activity
- Creating a Custom Activity
- Indoor Activities
- Outdoor Activities
- Multisport
- Swimming
- Golfing
- Climbing Sports
- Starting an Expedition
- Connected Features
- Safety and Tracking Features
- Wi‑Fi® Connected Features
- Connect IQ Features
- Garmin Pay
- Music
- Heart Rate Features
- Wrist-based Heart Rate
- Running Dynamics
- Performance Measurements
- Turning Off Performance Notifications
- Detecting Performance Measurements Automatically
- Syncing Activities and Performance Measurements
- About VO2 Max. Estimates
- Viewing Your Predicted Race Times
- About Training Effect
- Heart Rate Variability and Stress Level
- Performance Condition
- Lactate Threshold
- Getting Your FTP Estimate
- Training Status
- Body Battery™
- Pulse Oximeter
- Training
- Clocks
- Navigation
- Saving Your Location
- Projecting a Waypoint
- Navigating to a Destination
- Navigating to a Point of Interest
- Creating and Following a Course on Your Device
- Creating a Round-Trip Course
- Viewing or Editing Course Details
- Using ClimbPro
- Marking and Starting Navigation to a Man Overboard Location
- Navigating with Sight 'N Go
- Navigating to Your Starting Point During an Activity
- Navigating to the Starting Point of a Saved Activity
- Stopping Navigation
- Map
- Compass
- Altimeter and Barometer
- History
- Customizing Your Device
- Activities and App Settings
- Changing the Order of an Activity in the Apps List
- Widgets
- Customizing the Controls Menu
- Watch Face Settings
- Sensors Settings
- Map Settings
- Navigation Settings
- Power Manager Settings
- System Settings
- Viewing Device Information
- Wireless Sensors
- Device Information
- Device Maintenance
- Troubleshooting
- My device is in the wrong language
- Is my smartphone compatible with my device?
- My phone will not connect to the device
- Can I use my Bluetooth sensor with my watch?
- My headphones will not connect to the device
- My music cuts out or my headphones do not stay connected
- Restarting Your Device
- Resetting All Default Settings
- Acquiring Satellite Signals
- The temperature reading is not accurate
- Maximizing the Battery Life
- Activity Tracking
- Getting More Information
- Appendix
- Index

treat or diagnose any medical condition or disease. Always defer
to your health care provider for any heart-related issues.
You can set the heart rate threshold value.
1
From the heart rate widget, hold MENU.
2
Select Options > Abnormal Heart Rate Alerts.
3
Select High Alert or Low Alert.
4
Set the heart rate threshold value.
Each time your heart rate exceeds or drops below the threshold
value, a message appears and the device vibrates.
Turning Off the Wrist-based Heart Rate Monitor
The default value for the Wrist Heart Rate setting is Auto. The
device automatically uses the wrist-based heart rate monitor
unless you pair an ANT+ heart rate monitor to the device.
NOTE: Disabling the wrist-based heart rate monitor also
disables the wrist-based pulse oximeter sensor. You can
perform a manual reading from the pulse oximeter widget.
1
From the heart rate widget, hold MENU.
2
Select Options > Status > Off.
Running Dynamics
You can use your compatible fēnix device paired with the
HRM-Tri accessory or other running dynamics accessory to
provide real-time feedback about your running form.
The running dynamics accessory has an accelerometer that
measures torso movement in order to calculate six running
metrics.
Cadence: Cadence is the number of steps per minute. It
displays the total steps (right and left combined).
Vertical oscillation: Vertical oscillation is your bounce while
running. It displays the vertical motion of your torso,
measured in centimeters.
Ground contact time: Ground contact time is the amount of
time in each step that you spend on the ground while
running. It is measured in milliseconds.
NOTE: Ground contact time and balance are not available
while walking.
Ground contact time balance: Ground contact time balance
displays the left/right balance of your ground contact time
while running. It displays a percentage. For example, 53.2
with an arrow pointing left or right.
Stride length: Stride length is the length of your stride from one
footfall to the next. It is measured in meters.
Vertical ratio: Vertical ratio is the ratio of vertical oscillation to
stride length. It displays a percentage. A lower number
typically indicates better running form.
Training with Running Dynamics
Before you can view running dynamics, you must put on a
running dynamics accessory, such as the HRM-Tri accessory,
and pair it with your device (Pairing Your Wireless Sensors,
page 39).
1
Hold MENU.
2
Select Activities & Apps.
3
Select an activity.
4
Select the activity settings.
5
Select Data Screens > Add New.
6
Select a running dynamics data screen.
NOTE: The running dynamics screens are not available for
all activities.
7
Go for a run (Starting an Activity, page 2).
8
Select UP or DOWN to open a running dynamics screen to
view your metrics.
Color Gauges and Running Dynamics Data
The running dynamics screens display a color gauge for the primary metric. You can display cadence, vertical oscillation, ground
contact time, ground contact time balance, or vertical ratio as the primary metric. The color gauge shows you how your running
dynamics data compare to those of other runners. The color zones are based on percentiles.
Garmin has researched many runners of all different levels. The data values in the red or orange zones are typical for less
experienced or slower runners. The data values in the green, blue, or purple zones are typical for more experienced or faster
runners. More experienced runners tend to exhibit shorter ground contact times, lower vertical oscillation, lower vertical ratio, and
higher cadence than less experienced runners. However, taller runners typically have slightly slower cadences, longer strides, and
slightly higher vertical oscillation. Vertical ratio is your vertical oscillation divided by stride length. It is not correlated with height.
Go to www.garmin.com/runningdynamics for more information on running dynamics. For additional theories and interpretations of
running dynamics data, you can search reputable running publications and websites.
Color Zone Percentile in Zone Cadence Range Ground Contact Time Range
Purple >95 >183 spm <218 ms
Blue 70–95 174–183 spm 218–248 ms
Green 30–69 164–173 spm 249–277 ms
Orange 5–29 153–163 spm 278–308 ms
Red <5 <153 spm >308 ms
Ground Contact Time Balance Data
Ground contact time balance measures your running symmetry and appears as a percentage of your total ground contact time. For
example, 51.3% with an arrow pointing left indicates the runner is spending more time on the ground when on the left foot. If your
data screen displays both numbers, for example 48–52, 48% is the left foot and 52% is the right foot.
Color Zone Red Orange Green Orange Red
Symmetry Poor Fair Good Fair Poor
Percent of Other Runners 5% 25% 40% 25% 5%
Ground Contact Time Balance >52.2% L 50.8–52.2% L 50.7% L–50.7% R 50.8–52.2% R >52.2% R
While developing and testing running dynamics, the Garmin team found correlations between injuries and greater imbalances with
certain runners. For many runners, ground contact time balance tends to deviate further from 50–50 when running up or down hills.
Most running coaches agree that a symmetrical running form is good. Elite runners tend to have quick and balanced strides.
Heart Rate Features 15