
Owner's Manual


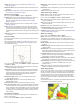


Table Of Contents
- EchoMap UHDOwner’s Manual
- Table of Contents
- Introduction
- Customizing the Chartplotter
- ActiveCaptain App
- Charts and 3D Chart Views
- Navigation Chart and Fishing Chart
- Zooming In and Out of the Chart
- Panning the Chart with the Keys
- Selecting an Item on the Map Using the Device Keys
- Chart Symbols
- Measuring a Distance on the Chart
- Creating a Waypoint on the Chart
- Navigating to a Point on the Chart
- Viewing Location and Object Information on a Chart
- Viewing Details about Navaids
- Heading Line and Angle Markers
- Premium Charts
- Automatic Identification System
- Chart Menu
- Supported Maps
- Navigation Chart and Fishing Chart
- Garmin Quickdraw Contours Mapping
- Mapping a Body of Water Using the Garmin Quickdraw Contours Feature
- Adding a Label to a Garmin Quickdraw Contours Map
- Garmin Quickdraw Community
- Garmin Quickdraw Contours Settings
- Navigation with a Chartplotter
- Basic Navigation Questions
- Destinations
- Waypoints
- Marking Your Present Location as a Waypoint
- Creating a Waypoint at a Different Location
- Marking an MOB Location
- Projecting a Waypoint
- Viewing a List of all Waypoints
- Editing a Saved Waypoint
- Moving a Saved Waypoint
- Browsing for and Navigating to a Saved Waypoint
- Deleting a Waypoint or an MOB
- Deleting All Waypoints
- Routes
- Auto Guidance
- Tracks
- Showing Tracks
- Setting the Color of the Active Track
- Saving the Active Track
- Viewing a List of Saved Tracks
- Editing a Saved Track
- Saving a Track as a Route
- Browsing for and Navigating a Recorded Track
- Deleting a Saved Track
- Deleting All Saved Tracks
- Retracing the Active Track
- Clearing the Active Track
- Managing the Track Log Memory During Recording
- Configuring the Recording Interval of the Track Log
- Boundaries
- Deleting All Saved Waypoints, Routes, and Tracks
- Sailing Features
- Sonar Fishfinder
- Stopping the Transmission of Sonar Signals
- Changing the Sonar View
- Traditional Sonar View
- Garmin ClearVü Sonar View
- SideVü Sonar View
- Panoptix Sonar Views
- Flasher View
- Selecting the Transducer Type
- Selecting a Sonar Source
- Creating a Waypoint on the Sonar Screen
- Pausing the Sonar Display
- Measuring Distance on the Sonar Screen
- Viewing Sonar History
- Sonar Sharing
- Adjusting the Level of Detail
- Adjusting the Color Intensity
- Sonar Recordings
- Traditional, Garmin ClearVü, and SideVü Sonar Setup
- Panoptix Sonar Setup
- Autopilot
- Force™ Trolling Motor Control
- Digital Selective Calling
- Gauges and Graphs
- Digital Switching
- Tide, Current, and Celestial Information
- Media Player
- Opening the Media Player
- Selecting the Media Source
- Playing Music
- Adjusting the Volume
- VHF Radio
- Radio
- DAB Playback
- SiriusXM Satellite Radio
- Setting the Device Name
- Updating the Media Player Software
- Device Configuration
- Sharing and Managing User Data
- Connecting to a Garmin Device to Share User Data
- Selecting a File Type for Third-Party Waypoints and Routes
- Copying User Data from a Memory Card
- Copying User Data to a Memory Card
- Copying Built-In Maps to a Memory Card
- Copying Waypoints, Routes, and Tracks from HomePort to a Chartplotter
- Backing Up Data to a Computer
- Restoring Backup Data to a Chartplotter
- Saving System Information to a Memory Card
- Clearing Saved Data
- Appendix
- Index
- EchoMap UHD Installation Instructions
- Printing a Mounting Template
- EchoMap UHD Template
- ClearVu Transducer Transom/Trolling Motor Mount Installation Instructions
- Important Safety and Product Information

Fish Eye 3D: Provides an underwater, three-dimensional view
that visually represents the sea floor according to the
information on the chart.
Fishing Charts: Shows the chart with enhanced bottom
contours and without navigational data. This chart works well
for offshore deep-sea fishing.
High Resolution Satellite Imagery: Provides high-resolution
satellite images for a realistic view of the land and water on
the Navigation chart (Showing Satellite Imagery on the
Navigation Chart, page 6).
Aerial Photos: Shows marinas and other navigationally
significant aerial photos to help you visualize your
surroundings (Viewing Aerial Photos of Landmarks,
page 6).
Detailed Roads and POI data: Shows detailed road and point
of interest (POI) data, which includes highly detailed coastal
roads and POIs such as restaurants, lodging, and local
attractions.
Auto Guidance: Uses specified information about your vessel
and chart data to determine the best path to your destination.
Viewing Tide Station Information
on the chart indicates a tide station. You can view a detailed
graph for a tide station to help predict the tide level at different
times or on different days.
NOTE: This feature is available with premium charts, in some
areas.
1
From the Navigation chart or Fishing chart, select a tide
station.
Tide direction and tide level information appear near .
2
Select the station name.
Animated Tide and Current Indicators
NOTE: This feature is available with premium charts, in some
areas.
You can view indicators for animated tide station and current
direction on the Navigation chart or the Fishing chart. You must
also enable animated icons in the chart settings (Chart Layer
Settings, page 8).
An indicator for a tide station appears on the chart as a vertical
bar graph with an arrow. A red arrow pointing downward
indicates a falling tide, and a blue arrow pointing upward
indicates a rising tide. When you move the cursor over the tide
station indicator, the height of the tide at the station appears
above the station indicator.
Current direction indicators appear as arrows on the chart. The
direction of each arrow indicates the direction of the current at a
specific location on the chart. The color of the current arrow
indicates the range of speed for the current at that location.
When you move the cursor over the current direction indicator,
the specific current speed at the location appears above the
direction indicator.
Color Current Speed Range
Yellow 0 to 1 knot
Orange 1 to 2 knots
Red 2 or more knots
Showing Tides and Current Indicators
NOTE: This feature is available with premium charts, in some
areas.
You can show static or animated tide and current station
indicators on the Navigation chart or Fishing chart.
1
From the Navigation or Fishing chart, select MENU > Layers
> Chart > Tides & Currents.
2
Select an option:
• To show animated tide station indicators and animated
current direction indicators on the chart, select Animated.
• To enables the tides and current slider, which sets the
time for which tides and currents are reported on the map,
select Slider.
Showing Satellite Imagery on the Navigation Chart
NOTE: This feature is available with premium charts, in some
areas.
You can overlay high-resolution satellite images on the land or
on both land and sea portions of the Navigation chart.
NOTE: When enabled, high-resolution satellite images are
present only at lower zoom levels. If you cannot see high-
resolution images in your optional chart region, you can select
to zoom in. You also can set the detail level higher by changing
the map zoom detail.
1
From the Navigation chart, select MENU > Layers > Chart >
Satellite Photos.
2
Select an option:
• Select Land Only to show standard chart information on
the water, with photos overlaying the land.
NOTE: This setting must be enabled to view Standard
Mapping
®
charts.
• Select Photo Map Blend to show photos on both the
water and the land at a specified opacity. Use the slider
bar to adjust the photo opacity. The higher you set the
percentage, the more the satellite photos cover both land
and water.
Viewing Aerial Photos of Landmarks
Before you can view aerial photos on the Navigation chart, you
must turn on the Photo Points setting in the chart setup.
NOTE: This feature is available with premium charts, in some
areas.
You can use aerial photographs of landmarks, marinas, and
harbors to help orient yourself to your surroundings or to
acquaint yourself with a marina or a harbor prior to arrival.
1
From the Navigation chart, select a camera icon:
• To view an overhead photo, select .
• To view a perspective photo, select . The photo was
taken from the location of the camera, pointed in the
direction of the cone.
2
Select Photo.
Automatic Identification System
The Automatic Identification System (AIS) enables you to
identify and track other vessels, and alerts you to area traffic.
When connected to an external AIS device, the chartplotter can
show some AIS information about other vessels that are within
range, that are equipped with a transponder, and that are
actively transmitting AIS information.
The information reported for each vessel includes the Maritime
Mobile Service Identity (MMSI), location, GPS speed, GPS
heading, time that has elapsed since the last position of the
vessel was reported, nearest approach, and time to the nearest
approach.
Some chartplotter models also support Blue Force Tracking.
Vessels being tracked with Blue Force Tracking are indicated on
the chartplotter with a blue-green color.
AIS Targeting Symbols
Symbol Description
AIS vessel. The vessel is reporting AIS information. The
direction in which the triangle is pointing indicates the
direction in which the AIS vessel is moving.
Target is selected.
6 Charts and 3D Chart Views