
Owner's Manual
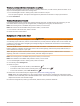
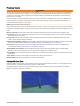
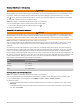
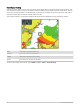
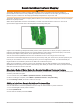
Table Of Contents
- ECHOMAP UHD2 Owner’s Manual
- Table of Contents
- Introduction
- Customizing the Chartplotter
- ActiveCaptain App
- Wireless Sharing
- Charts and 3D Chart Views
- Navigation Chart and Fishing Chart
- Chart Symbols
- Zooming In and Out of the Chart
- Panning the Chart with the Keys
- Selecting an Item on the Map Using the Device Keys
- Measuring a Distance on the Chart
- Creating a Waypoint on the Chart
- Viewing Location and Object Information on a Chart
- Viewing Details about Navaids
- Navigating to a Point on the Chart
- Premium Charts
- Chart Menu
- Supported Maps
- Navigation Chart and Fishing Chart
- Garmin Quickdraw Contours Mapping
- Mapping a Body of Water Using the Garmin Quickdraw Contours Feature
- Adding a Label to a Garmin Quickdraw Contours Map
- Garmin Quickdraw Community
- Garmin Quickdraw Contours Settings
- Navigation with a Chartplotter
- Basic Navigation Questions
- Route Color Coding
- Destinations
- Waypoints
- Marking Your Present Location as a Waypoint
- Creating a Waypoint at a Different Location
- Marking a Man Overboard (MOB) Location
- Projecting a Waypoint
- Viewing a List of all Waypoints
- Editing a Saved Waypoint
- Moving a Saved Waypoint
- Browsing for and Navigating to a Saved Waypoint
- Deleting a Waypoint or an MOB
- Deleting All Waypoints
- Routes
- Creating and Navigating a Route From Your Present Location
- Creating and Saving a Route
- Viewing a List of Routes and Auto Guidance Paths
- Editing a Saved Route
- Finding and Navigating a Saved Route
- Browsing for and Navigating Parallel to a Saved Route
- Initiating a Search Pattern
- Deleting a Saved Route
- Deleting All Saved Routes
- Auto Guidance
- Tracks
- Showing Tracks
- Setting the Color of the Active Track
- Saving the Active Track
- Viewing a List of Saved Tracks
- Editing a Saved Track
- Saving a Track as a Route
- Browsing for and Navigating a Recorded Track
- Deleting a Saved Track
- Deleting All Saved Tracks
- Retracing the Active Track
- Clearing the Active Track
- Managing the Track Log Memory During Recording
- Configuring the Recording Interval of the Track Log
- Boundaries
- Deleting All Saved Waypoints, Tracks, Routes, and Boundaries
- Sonar Fishfinder
- Stopping the Transmission of Sonar Signals
- Traditional Sonar View
- Garmin ClearVü Sonar View
- Flasher View
- Selecting the Transducer Type
- Selecting a Sonar Source
- Creating a Waypoint on the Sonar Screen
- Pausing the Sonar Display
- Viewing Sonar History
- Adjusting the Level of Detail
- Adjusting the Color Intensity
- Sonar Setup
- Gauges and Graphs
- Warning Manager
- Device Configuration
- Sharing and Managing User Data
- Appendix
- ECHOMAP UHD2 Installation Instructions
- Trolling Motor Mount Installation Instructions
- Printing a Mounting Template
- ECHOMAP UHD2 Template
- Important Safety and Product Information

User Data Layer Settings
You can show user data, such as waypoints, boundaries, and tracks, on the charts.
From a chart, select MENU > Layers > User Data.
Waypoints: Shows waypoints on the chart and opens the list of waypoints.
Boundaries: Shows boundaries on the chart and opens the list of boundaries.
Tracks: Shows tracks on the chart.
Water Layer Settings
From a chart, select MENU > Layers > Water.
NOTE: The menu may contain some settings that are not supported by your installed charts or your present
location. If you make changes to those settings, the changes will not impact the chart view.
NOTE: Not all settings apply to all charts, views, and chartplotter models. Some options require premium maps
or connected accessories.
Depth Shading: Specifies an upper and lower depth to shade between (Depth Range Shading, page 22).
Shallow Shading: Sets the shades from the shoreline to the specified depth.
Spot Depths: Turns on spot soundings and sets a dangerous depth. Spot depths that are equal to or more
shallow than the dangerous depth are indicated by red text.
Fishing Contours: Sets the zoom level for a detailed view of bottom contours and depth soundings and
simplifies map presentation for optimal use while fishing.
Relief Shading: Shows the gradient of the bottom with shading. This feature is available only with some
premium maps.
Sonar Imagery: Shows sonar imagery to help show the density of the bottom. This feature is available only with
some premium maps.
Lake Level: Sets the present water level of the lake. This feature is available only with some premium maps.
Charts and 3D Chart Views 21