
User manual
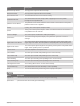
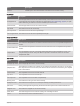
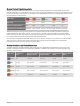
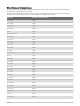
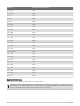
Table Of Contents
- Table of Contents
- Introduction
- Clocks
- Activities and Apps
- Starting an Activity
- Stopping an Activity
- Running
- Swimming
- Multisport
- Indoor Activities
- Climbing Sports
- Starting an Expedition
- Going Fishing
- Skiing
- Golfing
- Jumpmaster
- Customizing Activities and Apps
- Training
- Training for a Race Event
- Workouts
- PacePro Training
- Power Guide
- Segments
- Using Virtual Partner®
- Setting a Training Target
- Racing a Previous Activity
- History
- Appearance
- Watch Face Settings
- Glances
- Viewing the Glance Loop
- Customizing the Glance Loop
- Body Battery
- Performance Measurements
- Training Status
- Adding a Stock
- Controls
- Sensors and Accessories
- Map
- Music
- Connectivity
- User Profile
- Safety and Tracking Features
- Health and Wellness Settings
- Navigation
- Power Manager Settings
- System Settings
- Device Information
- Troubleshooting
- Product Updates
- Getting More Information
- My device is in the wrong language
- Is my phone compatible with my watch?
- My phone will not connect to the watch
- Can I use my Bluetooth sensor with my watch?
- My headphones will not connect to the watch
- My music cuts out or my headphones won't stay connected
- Restarting Your Watch
- Resetting All Default Settings
- Tips for Maximizing the Battery Life
- Acquiring Satellite Signals
- The temperature reading is not accurate
- Activity Tracking
- Appendix

Workout Fields
Name Description
Repetition The number of repetitions remaining for the workout.
Step Distance The current distance traveled during the workout step.
Step Pace The current pace during the workout step.
Step Speed The current speed during the workout step.
Step Time The time elapsed for the workout step.
Color Gauges and Running Dynamics Data
The running dynamics screens display a color gauge for the primary metric. You can display cadence, vertical
oscillation, ground contact time, ground contact time balance, or vertical ratio as the primary metric. The color
gauge shows you how your running dynamics data compare to those of other runners. The color zones are
based on percentiles.
Garmin has researched many runners of all different levels. The data values in the red or orange zones are
typical for less experienced or slower runners. The data values in the green, blue, or purple zones are typical for
more experienced or faster runners. More experienced runners tend to exhibit shorter ground contact times,
lower vertical oscillation, lower vertical ratio, and higher cadence than less experienced runners. However, taller
runners typically have slightly slower cadences, longer strides, and slightly higher vertical oscillation. Vertical
ratio is your vertical oscillation divided by stride length. It is not correlated with height.
Go to garmin.com/runningdynamics for more information on running dynamics. For additional theories and
interpretations of running dynamics data, you can search reputable running publications and websites.
Color Zone Percentile in Zone Cadence Range Ground Contact Time Range
Purple
>95 >183 spm <218 ms
Blue
70–95 174–183 spm 218–248 ms
Green
30–69 164–173 spm 249–277 ms
Orange
5–29 153–163 spm 278–308 ms
Red
<5 <153 spm >308 ms
128 Appendix