
Operation Manual


• Move away from sources that can interfere with your heart
rate monitor.
Sources of interference may include strong electromagnetic
fields, some 2.4 GHz wireless sensors, high-voltage power
lines, electric motors, ovens, microwave ovens, 2.4 GHz
cordless phones, and wireless LAN access points.
Running Dynamics
You can use your compatible
fēnix 3 device paired with the
HRM-Run
™
accessory to provide real-time feedback about your
running form. If your fēnix 3
device was packaged with the
HRM-Run accessory, the devices are already paired.
The HRM-Run accessory has an accelerometer in the module
that measures torso movement in order to calculate six running
metrics.
Cadence: Cadence is the number of steps per minute. It
displays the total steps (right and left combined).
Vertical oscillation: Vertical oscillation is your bounce while
running. It displays the vertical motion of your torso,
measured in centimeters for each step.
Ground contact time
: Ground contact time is the amount of
time in each step that you spend on the ground while
running. It is measured in milliseconds.
NOTE: Ground contact time is not available while walking.
Ground contact time balance
: Ground contact time balance
displays the left/right balance of your ground contact time
while running. It displays a percentage. For example, 53.2
with an arrow pointing left or right.
Stride length
: Stride length is the length of your stride from one
footfall to the next. It is measured in meters.
Vertical ratio
: Vertical ratio is the ratio of vertical oscillation to
stride length. It displays a percentage. A lower number
typically indicates better running form.
Training with Running Dynamics
Before you can view running dynamics, you must put on the
HRM-Run accessory and pair it with your device (Pairing ANT+
Sensors
, page
20)
. If your
fēnix
3 was packaged with the
accessory, the devices are already paired, and the
fēnix 3 is set
to display running dynamics.
1
Select an option:
• If your
HRM-Run accessory and
fēnix 3 device are already
paired, skip to step 8.
• If your
HRM-Run accessory and
fēnix 3 device are not
already paired, complete all the steps in this procedure.
2
Hold UP
.
3
Select Settings
> Apps
.
4
Select an activity.
5
Select
Data Screens.
6
Select a running dynamics data screen.
NOTE: The running dynamics screens are not available for
all activities.
7
Select Status > Enabled.
8
Go for a run (Going for a Run,
page
6).
9
Select
UP or DOWN to open a running dynamics screen to
view your metrics.
Color Gauges and Running Dynamics Data
The running dynamics screens display a color gauge for the primary metric. You can display cadence, vertical oscillation, ground
contact time, ground contact time balance, or vertical ratio as the primary metric. The color gauge shows you how your running
dynamics data compare to those of other runners. The color zones are based on percentiles.
Garmin
has researched many runners of all different levels. The data values in the red or orange zones are typical for less
experienced or slower runners. The data values in the green, blue, or purple zones are typical for more experienced or faster
runners. More experienced runners tend to exhibit shorter ground contact times, lower vertical oscillation, lower vertical ratio, and
higher cadence than less experienced runners. However, taller runners typically have slightly slower cadences, longer strides, and
slightly higher vertical oscillation. Vertical ratio is your vertical oscillation divided by stride length. It is not correlated with height.
NOTE:
The color gauge for ground contact time balance is different (
Ground Contact Time Balance Data,
page
3).
Go to www.garmin.com for more information on running dynamics. For additional theories and interpretations of running dynamics
data, you can search reputable running publications and websites.
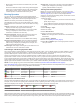
Color Zone Percentile in Zone Cadence Range Vertical Oscillation Range Vertical Ratio Ground Contact Time Range
Purple >95 >183 spm <6.4 cm <6.1% <218 ms
Blue 70–95 174–183 spm 6.4–8.1 cm 6.1–7.4% 218–248 ms
Green 30–69 164–173 spm 8.2–9.7 cm 7.5–8.6% 249–277 ms
Orange 5–29 153–163 spm 9.8–11.5 cm 8.7–10.1% 278–308 ms
Red <5 <153 spm >11.5 cm >10.1% >308 ms
Ground Contact Time Balance Data
Ground contact time balance measures your running symmetry and appears as a percentage of your total ground contact time. For
example, 51.3% with an arrow pointing left indicates the runner is spending more time on the ground when on the left foot. If your
data screen displays both numbers, for example 48–52, 48% is the left foot and 52% is the right foot.
Color Zone Red Orange Green Orange Red
Symmetry Poor Fair Good Fair Poor
Percent of Other Runners 5% 25% 40% 25% 5%
Ground Contact Time Balance >52.2% L 50.8–52.2% L 50.7% L–50.7% R 50.8–52.2% R >52.2% R
While developing and testing running dynamics, the Garmin
team found correlations between injuries and greater imbalances with
certain runners. For many runners, ground contact time balance tends to deviate further from 50–50 when running up or down hills.
Most running coaches agree that a symmetrical running form is good. Elite runners tend to have quick and balanced strides.
Heart Rate Features 3