GPSMAP 4000/5000 series ® owner’s manual
© 2009–2011 Garmin Ltd. or its subsidiaries All rights reserved. Except as expressly provided herein, no part of this manual may be reproduced, copied, transmitted, disseminated, downloaded or stored in any storage medium, for any purpose without the express prior written consent of Garmin.
Introduction Introduction WARNING See the Important Safety and Product Information guide in the product box for product warnings and other important information. This manual includes information for the following products: • • • • • • GPSMAP® 4008 GPSMAP 4010 GPSMAP 4012 GPSMAP 5008 GPSMAP 5012 GPSMAP 5015 Tips and Shortcuts • • • • Select Home from any screen to return to the Home screen. Select Menu from any main screen to access additional settings.
Table of Contents Table of Contents Introduction ������������������������������������������������i Tips and Shortcuts ���������������������������������������������� i Manual Conventions ������������������������������������������� i Getting Started ������������������������������������������1 Front and Back Panels �������������������������������������� 1 Turning On the Chartplotter ������������������������������� 2 Turning Off the Chartplotter ������������������������������� 2 Initial Chartplotter Setting
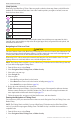
Getting Started Getting Started Front and Back Panels ➋ ➎ ➊ ➌ ➍ ➏ ➐ ➑ GPSMAP 4012 ➊ ➋ ➑ GPSMAP 5008 Item Description ➊ Power key ➋ Automatic backlight sensor ➌ Range keys ➍ Rocker key ➎ Soft keys ➏ MARK, SELECT, MENU, and HOME buttons ➐ Numeric keypad (4012 and 4212 only) ➑ Data card slot GPSMAP® 4000/5000 Series Owner’s Manual 1
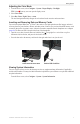
Getting Started ➋ ➌ ➊ ➍ Item ➊ ➎ Description Network connectors NMEA 2000 connector Power connector Video connector NMEA 0183 connector ➋ ➌ ➍ ➎ Turning On the Chartplotter Select . Turning Off the Chartplotter Hold . Initial Chartplotter Settings The first time you turn on the chartplotter, you must configure a series of initial settings. You must also configure these settings when restoring original factory settings (page 104). You can update each of these settings later.
Getting Started Adjusting the Color Mode 1. From the Home screen, select Configure > System > Beeper/Display > Backlight. tip: Select from any screen to open the display screen. 2. Select Color Mode. 3. Select Day Colors, Night Colors, or Auto. The Auto setting automatically changes the color scheme based on sunrise and sunset times.
Getting Started About the Home Screen You can use the Home screen to access all other screens. Note: Options on this screen vary based on the chartplotter type and optional connected devices.
Charts and 3D Chart Views Charts and 3D Chart Views All GPSMAP 4000/5000 series chartplotters have a basic imagery map. The GPSMAP 4208, 4210, 4212, 5208, 5212, and 5215 chartplotters have built-in, detailed, BlueChart g2 offshore cartography for US waters. The charts and 3D chart views listed below are available on the chartplotter. Note: Mariner’s Eye 3D and Fish Eye 3D Chart views are available only if you use a BlueChart g2 Vision data card (page 21).
Charts and 3D Chart Views Chart Symbols BlueChart g2 and BlueChart g2 Vision Charts use graphic symbols to denote map features, which follow the standards for US and international charts. Some other common symbols you might see include, but are not limited to, those shown below.
Charts and 3D Chart Views 3. Complete an action: • For the GPSMAP 4000 series, use the Rocker to pan the map. • For the GPSMAP 5000 series, touch and drag the Navigation screen to pan the map. When you pan past the edge of the map, the screen scrolls forward to provide continuous map coverage. The position icon ( ) stays at your present location. If the position icon leaves the map when you pan, a small window (inset map) appears on the left of the screen so you can keep track of your present position.
Charts and 3D Chart Views 5. Complete an action: • Select Label to display the name and symbol. • Select Comment to display any comments you have added. • Select Symbol to display only the symbol. • Select Hide to hide the symbol. Setting the Color of the Active Track See (page 37). Showing or Hiding Colored Tracks You can specify the color of tracks (page 37) and then show or hide all tracks of that color. 1. From the Home screen, select Charts. 2. Select Navigation Chart, Fishing Chart, or Radar Overlay.
Charts and 3D Chart Views Viewing Additional Object Information You can view information about on-screen map items, waypoints, and charts. Note: Mariner’s Eye 3D and Fish Eye 3D Chart views are available only if you use a BlueChart g2 Vision data card (page 21). The Fishing Chart is available if you use a BlueChart g2 Vision data card or a BlueChart g2 Data card, or if your built-in map supports Fishing Charts. 1. From the Home screen, select Charts. 2. Select a chart or a 3D chart view. 3.
Charts and 3D Chart Views Showing and Configuring Tides and Currents You can show tide and current information on the Navigation Chart or the Fishing Chart. Note: The Fishing Chart is available with a preprogrammed BlueChart g2 Vision data card. 1. 2. 3. 4. 5. 6. From the Home screen, select Charts. Select Navigation Chart or Fishing Chart. Select Menu. Select Chart Setup. Select Tides/Currents.
Charts and 3D Chart Views Changing the Map Zoom Detail You can adjust the amount of detail shown on the map, at different zoom levels, for the Navigation Chart or the Fishing Chart. 1. 2. 3. 7. From the Home screen, select Charts. Select Navigation Chart or Fishing Chart. Select Menu > Chart Setup > Chart Appearance > Detail. Select a level of detail. Selecting a World Map You can use either a basic world map or satellite imagery on the Navigation chart or the Fishing chart.
Charts and 3D Chart Views Selecting the Heading Line Source The source for the display of the heading line on the chartplotter is determined by the heading line source setting (Auto or GPS Hdg) and whether heading information is available from a heading sensor. • If heading information is available from a heading sensor and the source heading is set to Auto, both the heading line and the vehicle icon will be aligned to the heading from the sensor.
Charts and 3D Chart Views Showing and Configuring Navaid Symbols You can show and configure the appearance of navaid symbols on the Navigation Chart, Fishing Chart, or Radar Overlay. Note: The Fishing Chart is available with a preprogrammed BlueChart g2 Vision data card. 1. From the Home screen, select Charts. 2. Complete an action: • Select Navigation Chart > Menu > Chart Setup > Chart Appearance > Symbols. • Select Fishing Chart > Menu > Chart Setup > Chart Appearance.
Charts and 3D Chart Views Showing and Configuring Roses On the Navigation Chart or the Fishing Chart, you can show a compass rose ➊ around your boat, indicating compass direction oriented to the heading of the boat. True wind direction or apparent wind direction appears ➋ if the chartplotter is connected to a compatible marine wind sensor. Note: The Fishing Chart is available with a preprogrammed BlueChart g2 Vision data card. ➋ 1. 2. 3. 6. ➊ From the Home screen, select Charts.
Charts and 3D Chart Views Automatic Identification System The Automatic Identification System (AIS) enables you to identify and track other vessels. About AIS AIS alerts you to area traffic. When connected to an external AIS device, the chartplotter can show some AIS information about other vessels that are within range, that are equipped with a transponder, and that are actively transmitting AIS information.
Charts and 3D Chart Views Heading and Projected Course of Activated AIS Targets When heading and course over ground information are provided by an activated AIS target, the heading of the target appears on a chart as a solid line attached to the AIS target symbol. A heading line does not appear on a 3D chart view. The projected course of an activated AIS target appears as a dashed line on a chart or a 3D chart view.
Charts and 3D Chart Views 1. 2. 3. 4. From the Home screen, select Charts. Select Navigation Chart, Fishing Chart, Perspective 3D, Mariner’s Eye 3D, or Radar Overlay. Select Menu > Other Vessels > Display Setup. Complete an action: • Select Display Range to indicate the distance from your location within which AIS vessels appear. Select a distance. • Select MARPA > Show to show MARPA-tagged vessels.
Charts and 3D Chart Views 4. Select Time To to sound an alarm if AIS or MARPA determines that a target will intersect the safe zone within the defined time interval (ranging from 1 to 24 minutes). 5. Select a time. Viewing a List of AIS and MARPA Threats Note: The Mariner’s Eye 3D chart view is available if you use a BlueChart g2 Vision data card. The Fishing Chart is available if you use a BlueChart g2 Vision data card or a BlueChart g2 Data card, or if your built-in map supports Fishing Charts. 1. 2. 3.
Charts and 3D Chart Views Perspective 3D Perspective 3D provides a view from above and behind the boat (according to your course) and provides a visual navigation aid. This view is helpful when navigating tricky shoals, reefs, bridges, or channels, and is beneficial when trying to identify entry and exit routes in unfamiliar harbors or anchorages. From the Home screen, select Charts > Perspective 3D.
Charts and 3D Chart Views Selecting a Lane Width You can indicate the width of the navigation lane appearing in Perspective 3D or Mariner’s Eye 3D. Note: Mariner’s Eye 3D is available with a preprogrammed BlueChart g2 Vision data card. 1. 2. 3. 4. 5. From the Home screen, select Charts. Select Perspective 3D or Mariner’s Eye 3D. Select Menu > Chart Appearance > Lane Width. Enter the width. Select Done. Showing Surface Radar The chartplotter must be connected to a marine radar to show surface radar.
Charts and 3D Chart Views Radar Overlay When you connect your chartplotter to an optional Garmin marine radar, you can use Radar Overlay to overlay radar information on the Navigation Chart or on the Fishing Chart (page 73). BlueChart g2 Vision An optional, preprogrammed BlueChart g2 Vision data card allows you to get the most out of your chartplotter.
Charts and 3D Chart Views Mariner’s Eye 3D A BlueChart g2 Vision data card offers Mariner’s Eye 3D, which provides a detailed, three‑dimensional view from above and behind the boat (according to your course) and provides a visual navigation aid. This view is helpful when navigating tricky shoals, reefs, bridges, or channels, and when trying to identify entry and exit routes in unfamiliar harbors or anchorages. From the Home screen, select Charts > Mariner’s Eye 3D.
Charts and 3D Chart Views Showing Range Rings See “Showing Range Rings” (page 19). Selecting a Safe Depth Appearance You can set the appearance of a safe depth for Mariner’s Eye 3D. Note: This setting affects only the appearance of hazard colors in Mariner’s Eye 3D. It does not effect the safe water depth Auto Guidance setting (page 53) or the sonar shallow water alarm setting (page 94). 1. From the Home screen, select Charts > Mariner’s Eye 3D > Menu > Chart Appearance > Safe Depth. 2. Enter the depth.
Charts and 3D Chart Views Fish Eye 3D Chart Appearance Indicating the Direction of the Fish Eye 3D Chart View 1. From the Home screen, select Charts > Fish Eye 3D > Menu > View. 2. Select Fore, Aft, Port, or Starboard. Showing a Sonar Cone on the Chart You can show a cone that indicates the area covered by your transducer. From the Home screen, select Charts > Fish Eye 3D > Menu > Sonar Cone > On. Showing Suspended Targets From the Home screen, select Charts > Fish Eye 3D > Menu > Fish Symbols > On.
Charts and 3D Chart Views Showing Satellite Imagery on the Navigation Chart You can overlay high-resolution satellite images on the land, on the sea, or on both portions of the Navigation Chart when using a preprogrammed BlueChart g2 Vision data card. NOTE: When enabled, high-resolution satellite images are present only at lower zoom levels.
Charts and 3D Chart Views Viewing Aerial Photos of Landmarks Before you can view aerial photos on the Navigation Chart, you must turn on the Photo Points setting (page 13). Preprogrammed BlueChart g2 Vision data cards contain aerial photographs of many landmarks, marinas, and harbors. Use these photos to help orient yourself to your surroundings or to acquaint yourself with a marina or a harbor prior to arrival. 1. From the Home screen, select Charts > Navigation Chart. 2. Select a camera icon.
Combinations Combinations About the Combinations Screen The Combinations screen shows a combination of different screens at the same time. The number of options available on the Combinations screen depends on the optional network devices you have connected to your chartplotter, and whether you are using an optional BlueChart g2 Vision data card. You can combine up to three screens in the GPSMAP 4000 series and up to four screens in the GPSMAP 5000 series.
Combinations Combination Screen Data Fields Data fields can appear on combination screens, and they provide real-time, at-a-glance information. The data field overlay for each combination can be configured separately. Several combination screen data overlays are available. You can select the data fields ➊ to be shown within each data overlay. ➊ Adding a Data Field The Combinations screen can display up to six data fields in the GPSMAP 4000 series, and up to eight data fields in the GPSMAP 5000 series. 1.
Combinations Editing a Data Field 1. From the Home screen, select Combinations. 2. Select a combination. 3. Select a data field. 4. Select the type of data shown in the field. Available data options vary based on the chartplotter and network configuration. Viewing Instrumentation Data You can view engine gauges or fuel gauges in a combinations screen. 1. 2. 3. 4. 5. From the Home screen, select Combinations. Select a combination. Select Menu > Change Combination. Select a numbered option.
Combinations Using Full-screen View You can view the content of any combination screen on the full chartplotter screen. 1. From the Home screen, select Combinations. 2. Select a combination. 3. For the GPSMAP 4000 series, ensure that the combination screen you want to view on the full chartplotter screen is in the focus screen. If it is not, select the icon in the lower-right corner that represents the screen you want to view on the full chartplotter screen. 4.
Navigation Navigation Basic Navigation Questions Question How do I make the chartplotter point me in the direction in which I want to go (bearing)? How do I make the chartplotter giude me along a straight line (minimizing cross track) to a location using the shortest distance from the present location? How do I make the chartplotter guide me to a location while avoiding obstacles? How do I make the chartplotter steer my automatic pilot? Can the chartplotter create a path for me? How do I change the Auto G
Navigation • Guide To—uses BlueChart g2 Vision Chart data to suggest the best path to your destination using Auto Guidance. You must be using a BlueChart g2 Vision data card for this option to appear. Setting and Following a Direct Course Using Go To CAUTION When using Go To, a direct course and a corrected course may pass over land or shallow water. Use visual sightings and steer to avoid land, shallow water, and other dangerous objects.
Navigation • Select Depth. Select Done. • Select Water Temp. Select Done. • Select Comment. Select Done. Marking and Navigating to an MOB Location When you mark a waypoint, you can designate it as a man-overboard (MOB) location. From any screen, select Mark > Man Overboard. An international MOB symbol marks the active MOB point and the chartplotter sets a course back to the marked location using the Go To feature.
Navigation Creating and Navigating a Route from Your Present Location You can create and immediately navigate a route on the Navigation Chart or the Fishing Chart. This procedure does not save the route or the waypoint data. Note: The Fishing Chart is available if you use a BlueChart g2 Vision data card or a BlueChart g2 Data card, or if your built-in map supports Fishing Charts. 1. From the Home screen, select Chart. 2. Select Navigation Chart or Fishing Chart. 3. Select a destination ➊ using the cursor.
Navigation 11. Complete an action: • Select No. • Select Yes > Edit Route > Name. Enter the name of the route. Select Done. Creating and Saving a Route This procedure saves the route and all the waypoints in it. The starting point can be your present location or another location. 1. From the Home screen, select Information > User Data > Routes > New Route. 2. Select the starting point ➊ of the route: • Select Use Chart. Select a location on the chart. • Select Use Waypoint List and select a saved waypoint.
Navigation Viewing a List of Saved Routes From the Home screen, select Information > User Data > Routes. Editing a Saved Route You can change the name of a route, or change the turns the route contains. 1. 2. 3. 4. From the Home screen, select Information > User Data > Routes. Select the route to edit. Select Review > Edit Route. Complete an action: • Select Name. Enter the name. Select Done. • Select Edit Turns > Use Chart. Select the turn on the chart. Select Edit Turn > Move Turn.
Navigation ➊ Setting the Color of the Active Track You can select the color of your present track. 1. From the Home screen, select Information > User Data > Tracks > Active Track Options > Track Color. 2. Select a track color. Saving the Active Track The track currently being recorded is called the active track. 1. From the Home screen, select Information > User Data > Tracks > Save Active Track. 2. Complete an action: • Select the time the current track began or Midnight, if shown. • Select Entire Log.
Navigation • Select the time the current track began or Midnight, if shown. • Select Entire Log. 3. Select Follow Track. 4. Review the course indicated by the colored line. 5. Follow the colored line, steering to avoid land, shallow water, and other obstacles. Clearing the Active Track From the Home screen, select Information > User Data > Tracks > Clear Active Track. The track memory is cleared, and the current track continues to be recorded. Managing the Track Log Memory During Recording 1.
Where To? Where To? Use the Where To? option on the Home screen to search for and navigate to nearby fuel, repairs, and other services, as well as waypoints and routes that you have created. Marine Services Destinations NOTE: This feature may not be available in all areas. The chartplotter contains information about thousands of destinations offering marine services.
Where To? Searching for, and Navigating to, a Destination CAUTION The Auto Guidance feature of the BlueChart g2 Vision data card is based on electronic chart information. That data does not ensure obstacle and bottom clearance. Carefully compare the course to all visual sightings and avoid any land, shallow water, or other obstacles that may be in your path. When using Go To, a direct course and a corrected course may pass over land or shallow water.
Where To? From the Home screen, select Where To? > Routes. Select a route. Select Navigate To. Complete an action: • Select Forward to navigate the route from the starting point used when the route was created. • Select Backward to navigate the route from the destination point used when the route was created. A magenta line appears. In the center of the magenta line is a thinner purple line that represents the corrected course from your current location to the destination.
Almanac, Environmental, and On-boat Data Almanac, Environmental, and On-boat Data The Information screen displays information about tides, currents, celestial data, gauges, and video. Almanac Data Tide Station Information The Tides screen shows information about a tide station ➊ for a specific date and time ➋, including the tide height ➌, and when the next high and low tides will occur ➍.
Almanac, Environmental, and On-boat Data Current Information Note: Current station information is available with a BlueChart g2 Vision data card. The Currents screen shows information about a current station ➊ for a specific date and time, including the current speed and level ➋. By default, the chartplotter shows current information for the most-recently viewed current station and for the present date and time. From the Home screen, select Information > Tides/Currents > Currents.
Almanac, Environmental, and On-boat Data Celestial Information The Celestial screen shows information about sunrise, sunset, moonrise, moonset, moon phase, and the approximate sky view location of the sun ➊ and moon ➋. By default, the chartplotter shows celestial information for the present date and time. The center of the screen ➌ represents the sky overhead, and the outermost rings represent the horizon ➍. From the Home screen, select Information > Tides/Currents > Celestial.
Almanac, Environmental, and On-boat Data Configuring a Graph You can set the scale and duration of the Atmospheric Pressure and Depth graphs. The duration represents the time interval that appears on the graph, and the scale represents the range of the measured data that appears on the graph, including specific maximum and minimum values. 1. 2. 3. 4. From the Home screen, select Information > Graphs. Select Atmo. Pressure or Depth. Select Graph Setup.
Almanac, Environmental, and On-boat Data Wind Angle Data Viewing the Wind Angle Data Graph The chartplotter must be connected to the peripheral devices listed below to capture the data shown on the wind speed graph. Wind Angle Description Apparent Wind Shows wind direction data based on the flow of air experienced while on a boat in motion. This is the Apparent Wind Angle, which is calculated in reference to the bow of the boat, and is represented in degrees port or degrees starboard.
Almanac, Environmental, and On-boat Data On-boat Data Engine and Fuel Gauges Viewing Engine Gauges You must be connected to a NMEA 2000 network capable of sensing engine data to view engine gauges. See the GPSMAP 4000/5000 Series Installation Instructions for details. From the Home screen, select Information > Engines. Cycling Through Engine and Fuel Gauge Screens 1. From the Home screen, select Information > Engines. 2.
Almanac, Environmental, and On-boat Data Selecting the Engine Gauge Type You can set the type of gauges that appear on the first engine gauge page. If you have one or two engines, you can view either analog or digital gauges. If you have three or more engines, you can view only digital gauges. From the Home screen, select Information > Engines > Menu > Gauge Setup > Style.
Almanac, Environmental, and On-boat Data Fuel Gauges A maximum of two fuel gauges, an upper gauge and a lower gauge, appear above and below the speedometer in the center of the Fuel Gauges page. You must have fuel level sensors in your fuel tanks or a fuel flow sensor to capture the data shown in the fuel gauges.
Almanac, Environmental, and On-boat Data Resetting Trip Gauges 1. From the Home screen, select Information > Trip. 2. Complete an action: • Select Reset Trip to set all the readings for the current trip to 0.0. • Select Reset Maximum Speed to set the maximum speed reading to 0.0. • Select Reset Odometer to set the odometer reading to 0.0. • Select Reset All to set all the readings to 0.0.
Device Configuration Device Configuration Basic Device Configuration Questions Question How do I adjust the amount of detail shown on the map? How do I change the time zone setting? How do I change the language setting? How do I adjust the brightness of the backlight? How do I show a compass tape at the top of the chart? How do I change the color of the active track? How do I delete the track log on the map? How do I transfer waypoints to a memory card? How do I erase all waypoints, routes, and tracks? How
Device Configuration Display Configuration Setting the Sound You can set when the chartplotter makes audible sounds. 1. From the Home screen, select Configure > System > Beeper/Display > Beeper. 2. Complete an action: • Select Alarms Only to have the chartplotter beep only when alarms are triggered (default). • Select Key and Alarm to have the chartplotter beep when keys are pressed and when alarms are triggered. Setting the Language You can select the language that appears on the chartplotter. 1.
Device Configuration Auto Guidance Line Configurations You can set the data the chartplotter uses when calculating an Auto Guidance line. Note: Auto Guidance is available with a preprogrammed BlueChart g2 Vision data card. Safe Water Depth and Safe Obstacle Height CAUTION The Safe Depth and Safe Height settings influence how the chartplotter calculates an Auto Guidance line. If an area has an unknown water depth or an unknown obstacle height, the Auto Guidance line is not calculated in that area.
Device Configuration 9. Complete an action: • If the placement of the Auto Guidance line is satisfactory, select Menu > Navigation Options > Stop Navigation. Proceed to step 11. • If the Auto Guidance line is too close to known obstacles, from the Home screen, select Configure > Preferences > Navigation > Auto Guidance > Shoreline Distance > Farthest.
Device Configuration Units of Measure You can set the units of measure the chartplotter shows, using a standardized system of measurements or creating a customized system of measurements. Selecting a Standardized System of Measurement 1. From the Home screen, select Configure > Preferences > Units > System Units. 2. Select Statute (mph, ft, ºF), Metric (kh, m, ºC), or Nautical (kt, ft, ºF).
Device Configuration Data Bars Data bars ➊ appear on specific charts and 3D chart views, radar views, and combination screens. The data bar for each chart or one 3D chart view must be configured separately. ➊ Perspective 3D with Data Bars Several data bars are available. You can select the data fields to be shown within each data bar. When data bars numbers are displayed on the chart, the navigation inset is shown during navigation.
Device Configuration Configuring the Navigation Data Bar You should show the navigation data bar before you configure it (page 56). 1. 2. 3. 4. From the Home screen, select Charts. Select a chart or a 3D chart view. Select Menu > Data Bars > Navigation > Data Bar Setup. Complete an action: • Select Route Leg. Select On to show waypoint velocity made good (VMG) when navigating a route or an Auto Guidance line (page 58). • Select Next Turn > Distance to show next turn data based on distance.
Device Configuration Wind VMG and Waypoint VMG in the Data Bars The chartplotter automatically switches between showing wind VMG and waypoint VMG in the data bars. Waypoint VMG appears under the following conditions: • The route leg section of the navigation data bar shows waypoint VMG when you are navigating a route or an Auto Guidance line.
Device Configuration Information about Your Boat Calibrating a Water Speed Device If you have a speed-sensing transducer, you can calibrate that speed-sensing device. 1. From the Home screen, select Configure > My Boat > Calibrate Water Speed. 2. Follow the on-screen instructions. Note: If the boat is not moving fast enough or the speed sensor is not registering a speed, a “Speed too low” message appears. Select OK, and safely increase the boat speed.
Device Configuration Setting the Off Course Alarm You can set an alarm to sound when you are off course by a specified distance. 1. From the Home screen, select Configure > Alarms > Navigation > Off Course > On. 2. Enter the off-course distance that triggers the alarm. 3. Select Done. System Alarms Setting the Clock Alarm You can set an alarm using the system (GPS) clock. 1. From the Home screen, select Configure > Alarms > System > Clock > On. 2. Enter the time that triggers the alarm. 3. Select Done.
Device Configuration 1. Complete an action: • Copy the data from HomePort to the prepared memory card (using an Data card reader attached to the computer) according to the process described in the HomePort help system. • Copy the data from MapSource to the prepared memory card (using an Data card reader attached to the computer) according to the process described in the MapSource help system. 2. Copy the data from the data card to the chartplotter. See “Copying Data from a Data Card” (page 61).
Device Configuration Copying Waypoints, Routes, and Tracks to or from all Chartplotters on a Network You can transfer waypoint, route, and track information from one chartplotter connected to the Garmin Marine Network to every other chartplotter connected to the network. 1. Connect the chartplotter to a Garmin Marine Network using the network port on the back of the chartplotter and a Garmin network cable. 2. From the Home screen, select Information > User Data > Data Transfer > Network. 3.
Radar Radar WARNING The marine radar transmits microwave energy that has the potential to be harmful to humans and animals. Before beginning radar transmission, verify that the area around the radar is clear. The radar transmits a beam approximately 12° above and below a line extending horizontally from the center of the radar. Avoid looking directly at the radar, because the eyes are the most-susceptible parts of the body.
Radar Radar Display Modes The Radar screen has five standard operating modes. Each mode is available for use only with a compatible radar (page 64). • Cruising mode—shows a full-screen image of the gathered radar information. • Harbor mode—intended for use in inland waters, this mode works best with short-range radar signals (2 nm or less). • Offshore mode—intended for use in open waters, this mode works best with long-range radar signals.
Radar Harbor Mode Harbor mode is the standard radar operation for use in inland waters with a GMR xHD radar. Harbor mode works best with short-range radar signals (2 nm or less). Note: If you switch from Sentry mode to Harbor mode, the radar switches to full-time transmission and disables any guard zones. Showing Harbor Mode From the Home screen, select Radar > Harbor. Harbor Mode Offshore Mode Offshore mode is the standard radar operation for use in open waters with a GMR xHD radar.
Radar Dual Range Mode Dual Range mode provides a side-by-side view of both short-range and long-range radar data with a GMR xHD radar. The two radar views provided in this mode can be especially useful at night or in inclement weather. Short-range radar data appears on the left side ➊ of the dual-range screen, and the signal range cannot exceed 3 nm (4 km).
Radar Setting the Standby and Transmit Times You must enable timed transmit before you can set the standby and transmit times (page 66). To help conserve power, you can indicate the radar standby time and the transmit time to implement periodic radar signal transmissions at set intervals. 1. 2. 3. 4. 5. 6. 7. From the Home screen, select Radar > Sentry > Menu > Sentry Setup. Select Stdby Time. Enter the time interval between radar signal transmissions. Select Done. Select Xmit Time.
Radar Radar Targeting Radar targeting enables you to identify and track objects. About MARPA MARPA is primarily used for collision avoidance, through object targeting and tracking. To use MARPA, you must assign a MARPA tag to a target. The radar system automatically monitors the tagged object and provides you with information about the object, including the range, bearing, speed, GPS heading, nearest approach, and time to nearest approach.
Radar Assigning a MARPA Tag to an Object Note: MARPA requires the use of a heading sensor and an active GPS signal. The heading sensor must provide the NMEA 2000 parameter group number (PGN) 127250, or the NMEA 0183 HDM or HDG output sentence. 1. 2. 3. 4. From the Home screen, select Radar. Select Cruising, Harbor, or Offshore. select an object or location ➊. Select Acquire Target ➋. ➋ ➊ Removing a MARPA Tag from a Target Object 1. 2. 3. 4. From the Home screen, select Radar.
Radar • Open the list in Dual Range mode. Select > Menu > Other Vessels > List > Show for the GPSMAP 4000 series. Select Left > Other Vessels > List > Show for the GPSMAP 5000 series. 4. Select the type of threats to include in the list (All Threats, MARPA threats only, or AIS threats only). Showing AIS Vessels on the Radar Screen AIS requires the use of an external AIS device and active transponder signals from other vessels. You can configure how other vessels appear on the Radar screen.
Radar Adjusting the VRM and the EBL You must show the VRM and the EBL before you can adjust them (page 70). You can adjust the diameter of the VRM and the angle of the EBL, which moves the intersection point of the VRM and the EBL. The VRM and the EBL configured for one mode are applied to all other radar modes. 1. From the Home screen, select Radar. 2. Select Cruising, Harbor, Offshore, or Dual Range. 3.
Radar Waypoints and Routes on the Radar Screen Marking a Waypoint on the Radar Screen 1. From the Home screen, select Radar. 2. Select a radar mode. 3. Select a location 4. Select Create Waypoint. Showing or Hiding Waypoints on the Radar Screen You can show waypoints that are within the range shown on the Radar screen. This setting does not apply to the Radar Overlay. 1. From the Home screen, select Radar > Radar Setup > Appearance > Waypoints. 2. Complete an action: • Select Show to show all waypoints.
Radar • Select Backward - Starboard to navigate the route from the destination point used when the route was created, to the right of the original route. 9. From the Home screen, select Radar. 10. Select Cruising, Harbor, Offshore, Dual Range, or Sentry. The route appears as a magenta line, with the starting point, destination, and turns indicated. 11. Review the course indicated by the magenta line. 12.
Radar Complete an action: • For the GPSMAP 4000 series, press the Range (-/+) keys to zoom out and zoom in. • For the GPSMAP 5000 series, touch and to zoom out and zoom in. Selecting a Chart Type for the Radar Overlay You can indicate whether the Navigation Chart or the Fishing Chart appears under the Radar Overlay. Note: The Fishing Chart is available with a preprogrammed BlueChart g2 Vision data card. 1. From the Home screen, select Radar > Radar Overlay > Menu > Setup > Chart Setup. 2.
Radar About the Range of Radar Signals The range of the radar signal indicates the length of the pulsed signal transmitted and received by the radar. As the range increases, the radar transmits longer pulses in order to reach distant targets. Closer targets, especially rain and waves, also reflect the longer pulses, which can add noise to the Radar screen.
Radar Default Gain and Clutter Settings Setting Default Value Gain Auto Sea Clutter Calm Rain Clutter Off FTC Off Crosstalk On Instructions See “Automatically Adjusting Gain on the Radar Screen” (page 76). See “Restoring the Default Sea Clutter Setting” (page 77). See “Restoring the Default Rain Clutter Setting” (page 78). See “Restoring the Default FTC Setting” (page 78). See Adjusting Crosstalk Clutter on the Radar Screen” (page 80).
Radar 1. From the Home screen, select Radar. 2. Select Cruising, Harbor, Offshore, Dual Range or Sentry mode. 3. Complete an action: • Select Menu > Gain for Cruising, Harbor, Offshore, or Sentry mode. • Configure the setting for the short-range screen in Dual Range mode. Select > Menu > Gain for the GPSMAP 4000 series. Select Left > Gain for the GPSMAP 5000 series. • Configure the setting for the long-range screen in Dual Range mode. Select > Menu > Gain for the GPSMAP 4000 series.
Radar 2. Select Cruising, Harbor, Offshore, Dual Range or Sentry mode. 3. Complete an action: • Select Menu > Noise Rejection > Sea Clutter for Cruising, Harbor, Offshore, or Sentry mode. • Configure the setting for the short-range screen in Dual Range mode. Select > Menu > Noise Rejection > Sea Clutter for the GPSMAP 4000 series. Select Left > Noise Rejection > Sea Clutter for the GPSMAP 5000 series. • Configure the setting for the long-range screen in Dual Range mode.
Radar Adjusting Rain Clutter on the Radar Screen You can adjust the appearance of clutter caused by rain. Reducing the radar range also can minimize rain clutter (page 63). Setting FTC Rain Clutter Description This setting affects the appearance of large, hazy masses of clutter caused by rain at any distance. This setting affects the appearance of nearby rain clutter and targets more than it affects the appearance of distant rain clutter and targets.
Radar Adjusting Crosstalk Clutter on the Radar Screen You can reduce the appearance of clutter caused by interference from another nearby radar source. On is the default value for the crosstalk setting. Note: Depending upon the radar in use, the crosstalk setting configured for use in one radar mode may or may not be applied to other radar modes or to the Radar Overlay (page 75). 1. From the Home screen, select Radar. 2. Select Cruising, Harbor, Offshore, Dual Range or Sentry mode. 3.
Radar Configuring the Navigation Data Bar on the Radar Screen You should show the navigation data bar before you configure it (page 80). 1. From the Home screen, select Radar. 2. Select Cruising, Harbor, or Offshore mode. 3. Select Menu > Radar Setup > Data Bars > Navigation > Data Bar Setup. 4. Complete an action: • Select Route Leg. Select On to show waypoint velocity made good when navigating a route or an Auto Guidance line. • Select Next Turn > Distance to show next-turn data based on distance.
Radar Radar Display Settings Setting the Radar Color Scheme You can set the color scheme used for all Radar screens. This setting does not apply to the Radar Overlay. 1. From the Home screen, select Radar > Radar Setup > Appearance > Color Scheme. 2. Select White, Black (for night mode colors), or Blue. Setting the Radar Display Orientation You can set the perspective of the radar display. The orientation setting applies to every radar mode. This setting does not apply to the Radar Overlay. 1.
Radar Radar Scanner and Antenna Settings Setting the Antenna Rotation Speed Note: You can set the rotation speed for GMR 18, 18 HD, 24, 24 HD, 404, 406, 404 xHD, 406xHD, 604 xHD, 606 xHD, 1204 xHD, or 1206 xHD radar only. The antenna does not rotate at high speed in Dual Range mode. 1. From the Home screen, select Radar > Radar Setup > Rotation Spd. 2. Complete an action: • Select Normal Speed.
Radar Radar Overlay Display Appearance Adjusting Gain and Clutter on the Radar Overlay See “About Gain and Clutter” (page 75). Setting the Radar Overlay Display Orientation See “Changing the Map Orientation” (page 10). Setting Data Bars for the Radar Overlay See “Data Bar Settings” (page 80). Tracks and Waypoints Settings Showing Tracks on the Radar Overlay You can set whether vessel tracks appear on the Radar Overlay.
Radar Radar Overlay Navigation Display Settings Changing the Map Zoom Detail You can adjust the amount of detail shown on the map, at different zoom levels, for the Radar Overlay. 1. From the Home screen, select Charts > Radar Overlay > Menu > Setup > Chart Setup > Detail. 2. Select a level of detail. Showing and Configuring the Heading Line The heading line is an extension drawn on the map from the bow of the boat in the direction of travel.
Radar Showing Additional Chart Details You can show additional information on the Radar Overlay. 1. From the Home screen, select Charts > Radar Overlay > Menu > Setup > Chart Setup > Symbols. 2. Complete an action: • Select Land POIs > On to show land-based points of interest (POIs). • Select Light Sectors to show the sector in which a navigational light is visible. Select On to filter out light sectors depending on the zoom level.
Sonar Sonar When connected to an optional Garmin GSD 22/24/26 sounder module and a transducer, your chartplotter can be used as a fishfinder. The GSD 22/24/26 connects through the Garmin Marine Network and shares sonar data with every chartplotter connected to the network. The GSD 22 and the GSD 24/26 models have slightly different features and options. Any differences are noted in the appropriate sections below.
Sonar Transducer frequencies Split-frequency Sonar View Water Temperature Log If you are using a temperature-capable transducer, the temperature log shows water temperature readings over time. You can view the temperature log by selecting Sonar > Water Temp from the Home screen. Setting the Temperature Log Range and Time Scales 1. From the Home screen, select Sonar > Water Temp. 2. Select Menu. 3. Complete an action: • Select Duration to set the time-elapsed scale. The default setting is 10 minutes.
Sonar Creating a Waypoint on the Sonar Screen 1. From the Home screen, select Sonar. 2. Select a sonar view. 3. Select Menu > Pause Sonar. 4. Set the location of the waypoint using the intersection point of the depth line and the distance line: • For the GPSMAP 4000 series, use the Rocker to move the intersection point. • For the GPSMAP 5000 series, touch and drag the intersection point. 5. Select an option: • For the GSD 22, select Create Waypoint. • For the GSD 24/26, select New Wpt.
Sonar Adjusting the Range and Gain with Shortcuts • When using a GPSMAP 4000/5000 series with a GSD 22 or GSD 24/26, select + and - to adjust the range. • When using a GPSMAP 4000 series with a GSD 24/26, in full-screen sonar view, select the Select key to switch between adjusting the gain and the range, if necessary. Select + and - to adjust the range or gain.
Sonar Configuring the Advanced Sonar Settings Note: These features are available only on the GSD 24 and GSD 26. Before you can configure the Temp. Source, you must have a SD 26 and more than one water-temperature sensor or temperature-capable transducer. With the GSD 24 and GSD 26, you can configure various sonar display and data source settings. 1. 2. 3. 4. From the Home screen, select Sonar. Select a sonar view. Select Menu > More > Advanced.
Sonar Noise and Interference Settings The noise rejection settings allow you to reduce the interference and the amount of clutter shown on the sonar screen. With the GSD 24 and GSD 26, you can adjust the noise rejection settings for each frequency independently. Showing Surface Noise You can set whether the returns near the surface of the water appear on the sonar screen. Hide surface noise to help reduce clutter. From the Home screen, select Sonar. Select a sonar view. Select Menu.
Sonar Showing the A-Scope The A-Scope is a vertical flasher along the right side of the screen that instantaneously shows the range to targets along a scale. From the Home screen, select Sonar. Select a sonar view. Select Menu. Select an option: • For the GSD 22, select Sonar Setup. • For the GSD 24/26, select More > Appearance. 5. Select A-Scope > On. 6. For the GSD 24/26, select a peak hold time. 1. 2. 3. 4.
Sonar Highlighting the Edge Note: This feature is available only on the GSD 24 and GSD 26. You can highlight the strongest signal from the bottom to help define the hardness or softness of the signal. 1. From the Home screen, select Sonar. 2. Select a sonar view. 3. Select Menu > More > Appearance > Edge > Off. Setting the Color Scheme You can set the color scheme for all sonar screens. From the Home screen, select Sonar. Select a sonar view. Select Menu.
Sonar Setting the Fish Alarm Note: This feature is available only on the GSD 22. You can set an alarm to sound when the chartplotter detects a suspended target of the specified size. 1. From the Home screen, select Configure > Alarms > Sonar > Fish. 2. Complete an action: • Select to sound an alarm for all fish sizes. • Select to sound an alarm for medium and large fish only. • Select to sound an alarm for large fish only.
Sonar 1. Measure the keel offset, based on the location of the transducer: Transducer at the water • If the transducer is installed at the water line line, measure the distance from the A (+) positive number transducer location to the keel of the boat. shows depth at the bottom Enter this value in step 3 as a positive of the keel. number. • If the transducer is installed at the bottom of the keel, measure the distance from the Transducer at the bottom transducer to the water line.
Digital Selective Calling Digital Selective Calling Chartplotter and VHF Radio Functionality The following table indicates the features that are available when you connect your chartplotter to a VHF radio over a NMEA 0183 network or a NMEA 2000 network. Functionality NMEA 0183 VHF Radio The chartplotter can transfer your GPS X position to your radio. If your radio is capable, GPS position information is transmitted with DSC calls.
Digital Selective Calling Adding a DSC Contact You can add a vessel to your DSC list. You can make calls to a DSC contact from the chartplotter (page 100). 1. 2. 3. 4. 5. From the Home screen, select Information > DSC List > Add Contact. Enter the Maritime Mobile Service Identity (MMSI) of the vessel. Select Done. Enter the name of the vessel. Select Done.
Digital Selective Calling Every position report call received is logged in the DSC list (page 97). Viewing a Position Report 1. From the Home screen, select Information > DSC List. 2. Select a position-report call. 3. Select Review. 4. Select Next Page or Previous Page to switch between details of the position report and a Navigation Chart marking the location. Calling a Tracked Vessel See “Making an Individual Routine Call” (page 100). Navigating to a Tracked Vessel 1.
Digital Selective Calling Vessel Trails on the Navigation Chart You can view trails for all tracked vessels on the Navigation Chart, the Fishing Chart, the Mariner’s Eye 3D Chart view, and the Radar Overlay. By default, a black dot ➊ appears for each previously reported position of a tracked vessel, and a Blue Flag symbol ➋ indicates the last reported position of the vessel. A black line ➌ indicating the path of the vessel also appears.
Digital Selective Calling 1. From the Home screen, select Information > DSC List. 2. Select a vessel or a station to call. 3. Select Review > Call with Radio > Send. The chartplotter sends information about the call to the radio. 4. On your Garmin VHF radio, select Call. Making an Individual Routine Call to an AIS Target When you connect your Garmin chartplotter to a Garmin VHF NMEA 2000-compatible radio, you can use the chartplotter interface to set up an individual routine call to an AIS target.
Appendix Appendix Specifications Physical Specifications Specification Size Devices GPSMAP 4008, 4208 GPSMAP 4010, 4210 GPSMAP 4012, 4212 GPSMAP 5008, 5208 GPSMAP 5012, 5212 GPSMAP 5015, 5215 GPSMAP 4008, 4208 GPSMAP 4010, 4210 GPSMAP 4012, 4212 GPSMAP 5008, 5208 GPSMAP 5012, 5212 GPSMAP 5015, 5215 GPSMAP 4008, 4208 GPSMAP 4010, 4210 GPSMAP 4012, 4212 GPSMAP 5008, 5208 GPSMAP 5012, 5212 GPSMAP 5015, 5215 All models Measurement 7” H × 11.2” W × 4.2” D (176.9 × 284.4 × 106 mm) 8.9” H × 13.4” W × 4.
Appendix Calibrating the GPSMAP 5000 Series Touchscreen The GPSMAP 5000 series chartplotter touchscreen does not normally require calibration. However, if the buttons do not seem to be responding properly, use the following process to calibrate the screen. 1. While the chartplotter is turned off, press the Power key. The Warning screen appears. 2. Touch anywhere on the black portion of the screen for approximately 15 seconds until the calibration screen appears. 3.
Appendix Saving System Information to a Memory Card You can save system information to a memory card as a troubleshooting tool. A Garmin Product Support representative may ask you to use this information to retrieve data about the marine network. 1. Insert a memory card into the Data card slot on the chartplotter. 2. Select Configure > System > System Information > Garmin Devices > Save to Card. 3. Remove the memory card.
Appendix Approved NMEA 0183 Sentences GPAPB, GPBOD, GPBWC, GPGGA, GPGLL, GPGSA, GPGSV, GPRMB, GPRMC, GPRTE, GPVTG, GPWPL, GPXTE, and Garmin proprietary sentencesPGRME, PGRMM, and PGRMZ. This chartplotter also includes support for the WPL sentence, DSC, and sonar NMEA 0183 input with support for the DPT (depth) or DBT, MTW (water temp), and VHW (water temp, speed, and heading) sentences. Configuring NMEA 0183 Output Sentences You can configure how the chartplotter sees NMEA 0183 output sentences. 1. 2.
Appendix NMEA 2000 GPSMAP 4000/5000 series chartplotters are NMEA 2000 certified and can receive data from a NMEA 2000 network installed on the boat to show specific information, such as depth, speed, water temperature, wind speed and direction, and engine data. You can also name your engines and tanks so that you can better identify their location on the boat.
Appendix Transmitting NMEA 0183 Data over a NMEA 2000 Network You can turn on, configure, or turn off output bridging. Output bridging occurs when a chartplotter takes NMEA 0183 data it receives from any source, formats it into NMEA 2000 data, and sends it over the NMEA 2000 bus. 1. From the Home screen, select Configure > Communications > NMEA 2000 Setup > Output Bridging. 2. Complete an action: • Select On to enable output bridging from the chartplotter.
Index Index A active tracks clearing 38 retracing 37 saving 37 add turn 34 aerial photos 21, 26 AIS radar 70 targeting 15, 101 threats 18, 69 alarms anchor drag 59 arrival 59 clock 60 collision 15, 17, 69 deep water 94 fish 95 GPS accuracy 60 navigation 59 off course 60 shallow water 94 sonar 94 system 60 total fuel onboard 60 unit voltage 60 water temperature 94 anchor drag alarm 59 animated currents, tides 10, 26 antenna rotation speed 83 size 83 apparent wind 57, 81 arrival alarm 59 Auto Guidance BlueCh
Index combinations screen 29 configuring 47 fuel economy 49 status alarms 47 synchronizing with fuel 49 viewing 49 fuel onboard 60 full-screen view 87 G gain default setting 76 large objects 76 radar 75 radar type 75 side lobes 77 sonar 89 Garmin Marine Network 62 gauges analog 48 digital 48 engine 47 fuel 49 limits 47 maximums 47 status alarms 47 trip 49 type 48 Go To 31, 39 GPS accuracy alarm 60 signals 2 graphs air temperature 46 atmospheric pressure 46 configuring 45 depth 46 environmental data 44 wate
Index Harbor mode 65 heading line 82 navigation lines 82 noise rejection 75 no-transmit zone 83 Offshore mode 65 optimizing display 74 orientation 82 overlay screen 73 range 63, 75 range rings 82 Sentry mode 66 timed transmit 66 transmitting 63 types 64, 75 zoom scale 63 Radar Overlay charts 21, 73, 74 showing 73 tracks 84 waypoints 84 zoom 73 rain clutter 75, 78 range keys 5 range rings 19, 82 rated maximum 47 rated minimum 47 rear panel 1 reset 104 roses 14 routes bypassing waypoint 36 copying 61 creatin
Index track color 37 turn transition 52 unit voltage 60 view 24 volume units 55 water temp 94 waypoint IDs 105 whiteline 93 wireless devices 104 world map 11 zoom 89 shallow water alarm 94 shoreline distance 53 side lobe interference 77 simulator mode 51 soft keys i software version 3 sonar alarms 94 appearance 89 a-scope 93 color gain 94 color scheme 94 cone 24 depth line 92 depth scale 89 frequencies 91 gain 89 noise 92 overlay numbers 93 scroll speed 90 surface noise 92 suspended targets 93 views 87 whi
For the latest free software updates (excluding map data) throughout the life of your Garmin products, visit the Garmin Web site at www.garmin.com. © 2009–2011 Garmin Ltd. or its subsidiaries Garmin International, Inc. 1200 East 151st Street, Olathe, Kansas 66062, USA Garmin (Europe) Ltd. Liberty House, Hounsdown Business Park, Southampton, Hampshire, SO40 9LR UK Garmin Corporation No. 68, Zhangshu 2nd Road, Xizhi Dist., New Taipei City, 221, Taiwan (R.O.C.) www.garmin.com October 2011 190-01077-00 Rev.