
User's Manual Part 2

User’s Guide Chapter 7 – Reference Manual
Currently Connected Administrators – logged administrators list in format: [administrator name, IP
address, and idling time in hours/minutes/seconds].
Uptime – indicates the time, expressed in days, hours and minutes since the system was last
rebooted [days/hours/minutes/seconds].
Software Runtime – indicates the time, expressed in days, hours and minutes since the software
reboot. The system itself can restart the software without rebooting the device
[days/hours/minutes/seconds].
Total Memory – total operational memory of your P-560 [kB].
Free Memory – indicates the memory currently available in the controller [kB].
Average Load – indicates the average load of the P-560 processor in the period of the last 1minute,
5 minutes and 15 minutes (a larger value means a larger average load on the processor).
Minimum load – 0.0
Normal load – should not exceed 1.0 (including)
Processor is busy – more than 1.00.
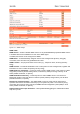
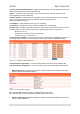
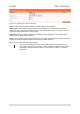
Connected Clients Number – total number of current connected clients on WAN interface. Click on
the settings and get detailed connected clients list (clients page under the connection | user):
Figure 151 – Connected Clients Detailed List
Connected Clients Input Bytes – current connected clients’ total Input bytes [K, KB, MB, GB].
Connected Clients Output Bytes – current connected clients’ total Output bytes [K, KB, MB, GB].
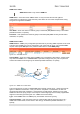
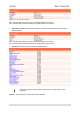
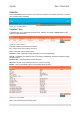
WAN interface (ixp1) (including the IP address, netmask, gateway, MAC address of the WAN
interface, DNS servers, RX/TX statistics)
Figure 152 – WAN Interface Statistics
RX – indicates data volume received on the WAN interface since reboot.
TX – indicates data volume transmitted to the WAN interface since reboot.
Wireless LAN interface (eth0) (including the IP address, netmask, MAC address of the WLAN
interface, RX/TX statistics)
Gemtek Systems Page 105