
User Manual


Page8
6. DISPLAY VIEWS
Therearefourviewsthatcanbeselectedtodisplaymeasurements:
•Chart
•Comparison
•Digital
•Waveform
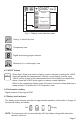
6.1 Chart view
Thisviewdisplaystheselectedmeasurement’svaluecorrespondingtoeachofthelast276
sparks,withtheleftmostmeasurementbeingtheoldest,andtherightmostthenewest.The
measurementscaleandunitsarelocatedontheverticalaxis,atthefarleftofthedisplay.
0
S
2
3
RPM
1
01607
RPM
Fig6-Chartmodedisplay
• ‘POWER/CLEAR’ button:
PressingthePower/Clearbuttonclearsallvaluesinthechart,andre-scalesthechart
ifnecessary.
• ‘MODE’ button:
Pressingthe‘MODE’buttononcewillopenthemodemenu,andhighlightthemeasurement
modecurrentlyselected;pressingthe‘MODE’buttonagainwhilethemenuisopenwill
selectthenextavailablemeasurementmode.Allfourmeasurements(sparkburntime,
RPM,sparkplugpeakvoltage,dwellangleandramptime)aresimultaneouslytracked
andstored,andareavailableforviewingatanytime(withoutdelay).
• ‘HOLD’ button:
Pressingthisbuttonwillpausethecurrentmeasurement,andholdthedisplayinitsthe
currentcondition.Pressingthe‘HOLD’buttonagainwillresumenormalmeasurement.
6.2 Comparison view
This modeallows the comparison of setsof values (minimum,average and maximum
measurements)betweenseveralcylinders,undervarioustestingconditions,andinmany
othersituations.Themeasurementsaredisplayedfromlefttoright,withtheleftmostsetof
valuesbeingtheoldest,andtherightmostthenewest.Anewsetofvaluesisaddedevery
timethe‘HOLD’buttonispressedtwice(start/stop)anduptothelast12setsofvalueswill
beshowninthegraphatonce,ifthismaximumisexceeded,theoldestsetwillbedeleted
andanewsetadded.Themeasurementscaleandunitsarelocatedontheverticalaxis,
atthefarleftofthedisplay.