
User manual


Digital High Frequency Analyser HF58B-r
© Gigahertz Solutions GmbH, 90579 Langenzenn, Germany Revision 4.5 (Febuary 2006) Page 12
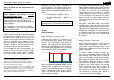
ing HF sources can be easily identified: 2.4-
GHz telephones (base station and handset)
as well as cellular phones, the signal patterns
of which can be divided into “a live con-
nected phone call“, “stand-by mode“ and
especially the “establishing of a connection“.
The typical signal patterns of a cellular phone
base station can also be identified this way.
For comparison reasons you are well advised
to take measurements during high-traffic
times, as well as some times during the
night, in order to familiarize yourself with the
different noises.
The volume can be controlled with the “vol-
ume” (speaker) knob. Note: The power con-
sumption of the speaker is directly propor-
tional to the volume.
The optional variable frequency filters VF2 or
VF4 available help to facilitate the audio
analysis significantly and at the same time
add to its accuracy. They filter out individual
frequencies so contributions from other
sources can be identified.
On our home page (www.gigahertz-
solutions.de) is a link to some typical sam-
ples of audio analyses as MP3-files.
For more on acoustical marking of un-
pulsed signals see the next section.
Analysis of the modulated /
pulsed signal ( total / pulse )
The exposure limits of pulsed radiation (acc.
to SBM2003) are lower by a factor of 10 than
that of non–pulsed signals. It is very impor-
tant to distinguish between these two types.
Without this knowledge you will not be able
to determine which limit to apply..
The feature to distinguish between these two
types of radiation in absolute numbers has
been introduced for a broad band instrument
of this price range for the first time. This is a
significant advantage over the commercial
spectrum analyzers, with which this differen-
tiation requires extra work.
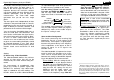
The little switch to the right of the display
allows one to distinguish between the com-
plete signal including the pulsed part and its
pulsed or modulated part only.
In the “Full” setting, the power densities of all
signals in the frequency range of interest are
displayed. In “Pulse” setting only those
which are amplitude modulated are dis-
played. Signals like GSM (mobile phone),
DECT, Radar and WLAN/Bluethooth and
others can have similar intensities in either
switch setting. Even within tolerance limits,
they have no content of carrier frequency.
Superposition and background radiation,
however, will mostly lead to a moderate dif-
ference in intensity.
Marking of unpulsed signals
Un-pulsed signals by their very nature are not
audible in the audio analysis and therefore
easily missed. For that reason they are
marked by a uniform “rattling” tone, with its
volume proportional to its contents of the
total signal. This “marking” has a frequency
of 16 Hz, and an audio sample can also be
downloaded as a MP3 file from our website.
This marking tone will only be audible with
the switch to the right of the display set to
“Full“. If the switch is set to “Pulse” the cir-
cuitry to suppress the content of un-pulsed
signals is activated. There will be nothing to
be marked.
Note concerning the switch setting “Pulse“:
Under special laboratory conditions a signal can be
created, which causes an additional deviation from the
actual value of up to -3 dB. Under field conditions like
DECT and GSM signals only minimal deviations.
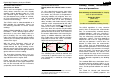
Use of Signal Outputs
AC output:
The AC output “PC/head-set”, 3.5 mm jack
socket, is meant for in-depth analysis of the
AM/pulsed content of the signal by headset
or a PC-audiocard and appropriate software.
For PC sound card or headphones or PC
software please ask or write us.
DC output (2.5 mm jack socket):
For logging devices or optional external dis-
play unit. When “Full Scale“ is displayed, it
has 1 VDC output, depending on the position
of switch 7.
The auto power off function is deactivated if
external devices are connected. Neverthe-
less, the battery is still protected against total
discharge.