
User manual
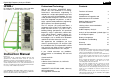

Digital High Frequency Analyser HF58B-r
© Gigahertz Solutions GmbH, 90579 Langenzenn, Germany Revision 4.5 (Febuary 2006) Page 9
Quantitative Measurement:
Determination of Total High Frequency
Pollution
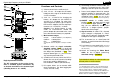
As described in Getting Started, attach the
LogPer antenna to the HF analyzer. Hold
the HF analyzer with a slightly outstretched
arm because objects (mass) directly behind
it “like yourself”, have effects on the testing
result. Your hand should not get too close to
the antenna, but should be near the bottom
end of the instrument.
In the area of a local maximum, the posi-
tioning of the HF analyzer should be changed
until the highest power density (the most im-
portant measurement value) can be located.
This can be achieved as follows:
- When scanning “all directions“ with the
LogPer to locate the direction from which
the major HF emission(s) originate, move
your wrist right and left. For emission
sources behind your back, you have to
turn around and place your body behind
the HF analyzer.
- Through rotating the HF analyzer, with at-
tached LogPer antenna, around its longi-
tudinal axis, determine the polarization
plane of the HF radiation.
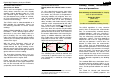
- Change the measurement position and
avoid measuring exclusively in one spot..
because that spot may have local or an-
tenna-specific cancellation effects.
Some manufacturers of field meters propa-
gate the idea that the effective power density
should be obtained by taking measurements
of all three axes and calculating the result.
Most manufacturers of professional testing
equipment, however, do not share this view.
In general, it is well accepted that
exposure limit comparisons should be
based on the maximum value emitted
from the direction of the strongest
radiation source.
But the details of the situation need to be
considered! For example, if a 2.4-GHz tele-
phone inside the house emits a similar level
of microwaves as a nearby cellular phone
base station outside the house, it would be
helpful to first turn off the 2.4-GHz telephone
in the house. Now measure the exposure
level originating from the outside. After hav-
ing measured the emission of the 2.4-GHz
telephone on its own, the sum of both meas-
urement values could be used for the expo-
sure assessment.
There is no “official regulation” nor clearly
defined testing protocol, because according
to German national standard-setting institu-
tions, as described earlier, quantitatively reli-
able, targeted and reproducible measure-
ments are only possible under “free field con-
ditions“ but not in indoor environments.
Cellular phone channel emissions vary with
the load. The minimum HF level occurs,
when only the control channel operates. It is
suggested that measurements should be
taken at different times during the day / week
in order to find out the times of highest traf-
fic.
Quantitative Measurement:
Special case 1: UMTS / 3G
(Universal Mobile Telecommunication Sys-
tem, also known as the third generation of
mobile phones.) This technology is designed
to process huge amounts of data and has a
narrowly meshed network.
For measuring UMTS/3G the switch “Low
Frequency” Video Bandwith should be set to
“TPmax”.
With LogPer aerial and in “Peak “ mode iden-
tify the main direction of the signal and
switch to “ Peak Hold – long”
Now “gather“ the highest value without mov-
ing the meter ( use a wooden tripod ) for at
least 2 minutes in the same position. This is
important as because of the signal character-
istics of the UMTS/3G signal fluctuations by
the factor +/- 6 are common.
To hear samples how a UMTS/3G signal
sounds in the audio-analysis please check
our website for links to MP3 files.
Please note that when measuring UMTS/3G
you should not
use the combination of
switch-positions ”Average” and
“Pulse” .