NFA 1000 NFA 400 NFAsoft Analysis and Configuration Software 3D Low Frequency Analyzer with Data Logger Operating Manual (Version 6.
Thank you! We thank you for the confidence you have shown by buying this product. It allows for a professional analysis of AC electric and AC magnetic fields according to internationally recognized guidelines and the recommendations of the building biology. In addition to this manual you can watch the tutorial videos on our website concerning the use of this meter.
Contents 1 Quick Start Guide ............................................................................................ 4 2 NFA 1000 Front Cover ..................................................................................... 5 3 LEDs / Display / Audio Signals ........................................................................ 6 4 Switches / Push-Buttons / Connectors ........................................................... 9 5 How to Measure and Data-Log .............................
1 Quick Start Guide The instructions below refer to the factory default settings. These settings can easily be customized with the help of the supplied software „NFAsoft“. When you switch on the instrument the LCD will briefly show “batt” and the remaining operation time in the log.-mode with the current capacity of the batteries.
2 Front Cover NFA 1000 and NFA 400 Analogous front cover for NFA 1000 and NFA 400 NFA 1000 AC/DC 3D-NF-Analyser 5 Hz - 1000 kHz Y Z Mode Auto Band Freq. / X mV nT mG V/m M3D XYZ E3D Signal tRMS TCO-Band I NFA 400: „Ey“ Power On II Hold Log Peak Off I/O X Y Z GIGAHERTZ Mode R Mad e in G ermany Rec.
3 LEDs / Display / Audio Signals 3.1 LEDs and Display The measured value shown on the display ... … is the unit adjacent to the solid green LED (primary measurement). A flashing LED indicates the unit of the secondary measurement, which can be selected by depressing the “Mode>” button . In fields of very high magnetic intensity, the value will be displayed in uT (microTesla), indicated by the red LED “X 1000”. Also the green LED will then turn red indicating a change of scale.
Status and Frequency LEDs The “Status” LED indicates the current mode of operation “Red” means “instrument is being charged”. “Yellow” means “measurement in progress, NO recording”. “Green” means “measurement in progress WITH recording”, however with the switch set to “log.” the “Status”-LED is switched off to extend battery life. LEDs to indicate the applicable frequency bands: The frequency-LEDs change their colour in proportion to their contribution to the total field strength.
There are two display modes for the frequency-LEDs: “Simple/Steady“: (= preset) 2 The red LED represents the strongest frequency , and the yellow LED the second strongest. The green LEDs indicate the total frequency range in the current setting. “Full Information/Volatile”: This makes the LEDs rather unsteady/volatile. (To be configured with NFAsoft) The proportion of the respective frequency band in relation to the total signal is being displayed.
4 Switches / Push-Buttons / Connectors 4.1 On / Off switch (“Power“) “On” = Standard Measurement Setting LEDs and acoustic signal remain activated for manual measurements “Log” = Logging / long term recording All LEDs and the acoustic signal are deactivated to save battery life during data logging. This is the mode in which the instrument is most precise. “Off” = Device is off 4.
For E-field measurements against earth potential, please plug in the grounding cable and - switch to “M3D” (automatic adjustment) on the NFA 1000 - switch to “Ey” on the NFA 400. 4.3 Sockets for Inputs and Grounding AC/DC = Combined AC/DC-Input The moment you connect an external sensor, its signal will automatically be displayed in mV and recorded, if required. For recording, make sure the “Mode” switch is set to “Auto”. AC: A displayed value of 2000 corresponds to “1Vpeak-peak“ 4. DC: +/- 0.
4.4 Mode = Selection of Measurement Mode Mode Auto Band Freq. / Selects all measurement and display options of the instrument with the field selector switch and the “Mode >” button. Configuration errors will be detected and indicated by “Err.” on the display until resolved. When set to the NFA recognizes probes connected to it, and shows the corresponding values. If there is no external probe connected to the instrument, it will show the selected 3D field type.
4.5 Evaluation of Signal Signal tRMS Hold Peak tRMS = true RMS value tRMS = “true Root Mean Square”. The values displayed and recorded can be compared directly to classifications recommended by building biologists. peak = Peak value Real peak value measurement: With this setting the meter measures the highest culminating point of the wave7.
4.7 USB-Socket USB 1.0 computer interface connection: Used for meter configuration with NFAsoft. Please take care to have the NFA switched off when connecting or disconnecting the USB-cable! 4.8 Charging Socket For the connection of external DC sources: 12-15 V External supply: 12 V battery or 12 V DC power supply unit is sufficient to keep the instrument operational for long term data logging, but will not recharge the battery.
If the “Mode”-button on the left is on “Band” or “Freq.”, Press and release the “Mode>” button to select the next frequency band (indicated by the corresponding LEDs), and also the axis per band in the “XYZ” mode. Press and release the “Mode>” and “Rec>” buttons at the same time to display the individual axis one after the other in an infinite loop until one of the buttons is pressed again.
5 How to Measure and Data-Log 5.1 “Live”-Measurement Of course the meter can be used the “conventional” way: simply switch it on, set the required measurement parameters, and read the values recorded. When operating in the conventional mode, the “Status-LED” will be yellow. In addition, the device is capable of logging all settings as well as the measurement values of all four channels at once (i.e. the three field axis values plus one additional channel).
The NFA guides the user through the nine points by means of short audio signals (“beeps”). These nine points shall always be processed in the same order, head area: left, middle, right, followed by torso area: left, middle, right and finally feet area: left, middle, right. The beeps are not time controlled but the NFA will adjust itself to your personal work rhythm by “sensing” whether it is being moved or it is lying still9.
Initiating Long Term Logging of the Meter For a long term recording of several hours or days, set the “Power” switch to “Log”. In this mode the LEDs and the sound are turned off to extend the battery life. The recording will start automatically after some seconds. The display will show the logfile number (“L999”), the elapsed time of recording as well as the remaining time of use in an infinite loop until the battery is empty or the SD-card full. For information on the display format please see chapter 3.2.
6 Power Supply 6.1 Internal Rechargeable Battery The instrument features high performance Lithium Ion rechargeable batteries (2 x 3.7 V). When fully charged, they will last for up to 36 hours of continuous data logging13. 6.2 Charging To charge the battery set the AC adapter switch to 15 Volts. If the device is switched off while charging, the display will show “CHAr” and the potential runtime of the instrument with the current capacity status in an infinite loop.
6.4 Operation from a Standard 9 V Alkaline Battery If you run out of battery power while measuring, one can temporarily operate the NFA from a standard 9 V alkaline battery. To change the battery, remove the NFA from its protective holster, and open the battery compartment. Carefully pull off the cables of the integrated lithium ion batteries from the PCB-connector and remove the batteries.
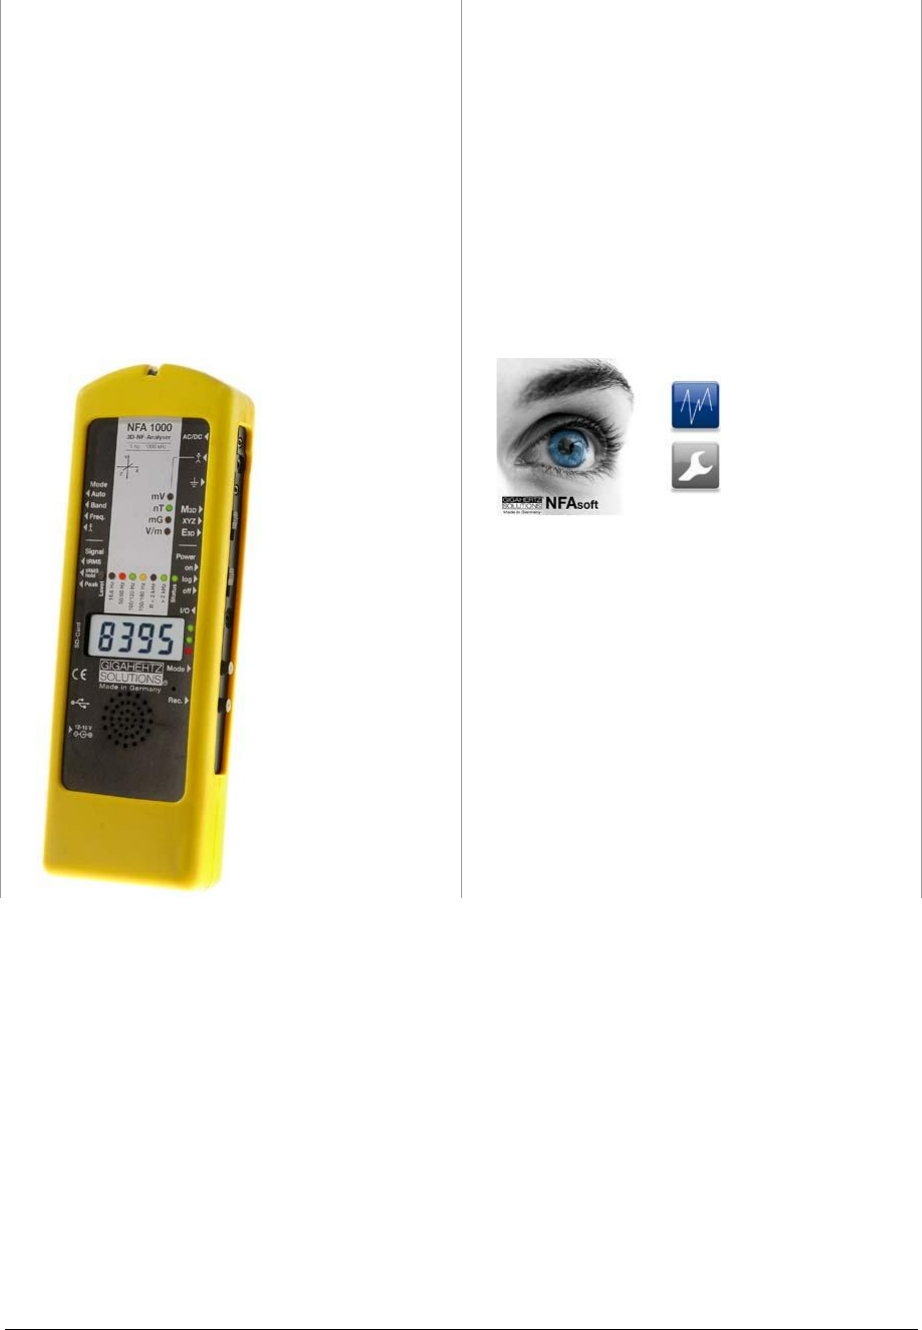
7 „NFAsoft“ The provided software allows ... for the analysis of the data logged by the NFA for the configuration of the NFA according to your preferences and habits. A double-click on the program-icon opens the window shown on the left. Here you can chose between the tool for the analysis of the data and the tool for the user-specific configuration of your NFA . The software is subject to continuous upgrade. The most current revision can always be found for download on our homepage.
7.2 Data Analysis: Longterm Recordings Double-click the appropriate log file for analysis. For longterm recordings the following window will open (check capter 7.2 for 9 point measurements) : The far left column labelled “Channels“ displays statistic evaluations of the plot on the right (in real-time) The large area on the right shows the plot of the collected data over time.
Scaling of the y-axis is done automatically by default but can be adjusted manually if desired through the “View” menu under “Y-Scale”. You can also adapt the scaling of the y-axis manually via the menu (under “View / Scale”). Listening to the Audio Notes Audio notes dictated during measurement or longterm recordings are shown in the diagram directly at the corresponding point of dictation. Simply click on them in order to listen to the information recorded.
The light-blue field underneath the statistical channel data represents the frequency distribution of the measured intensities of the specific channel („Histogram“). It is self-scaling and can be interpreted as follows: On the left side of the x-axis a formula calculates and plots how often the minimum value has occurred in a given time interval, and similarly on the right side for the maximum value. The higher point marks the measured intensity - found most often.
Channel Set Edge Criteria (experimental!) This feature is new and its intention is to facilitate professionals the dicussion and analysis of “dirty electricity” beyond today’s definition. Activate “Edge Dispay” in the menu option “View” to use this function. This function allows you to define a threshold value with which a spike can be marked directly in the “Edge Display” of the plot. This threshold can be selected individually for every channel. Standard values have been pre-selected as defaults.
Convert Units This function can be used to display whichever values recorded via the AC/DC input port directly in its original unit. This way, an HF-recording can be shown either in µW/m² or V/m. A new channel will autmatically be generated, thus avoiding any potential loss of data. More help to be provided in future revisions. Rename or Delete Channel Allows for a renaming or deleting of the marked channel.
7.4 User-specific Configuration of the NFA This part of NFAsoft allows for a customized user definable configuration of the NFA. The configurations will be made available in the “CONFIG.NFA” file of your NFA. The new settings are automatically loaded by the NFA upon its next start when saved on the SD memory card. Several customized pre-settings for NFAsoft can be defined allowing a quick access. Simply select the settings as required and activate the button “save as presetting for NFAsoft”.
8 Firmware Update The file: “firmware.nfa“ is the meter’s operating system stored in its internal memory16. As known from computer programmes, this software is subject to continuous improvements and upgrade, and can be updated as follows: Procedure for the Update: Copy the new “firmware.nfa“ file onto your SD memory card. If need be, overwrite any old versions as only one “firmware.nfa“ file should be on the card. It should not be renamed.
9 What if… (FAQ) Answers to frequently asked questions regarding the NFA1000 Make sure you’re always using the most current firmware version! The device does not react when trying to switch or press a key Unlock SD-card! (Push micro switch on the left of the card upwards) Restart: All switches up – switch off – switch on.
The sum of the frequency specific channels is higher than the value of “All3D” The signals of the different frequencies are added up quadratically (square root out of the sum of squares), which means that a simple addition of the individual signals will result in a higher value than the sum of “All3D”. For example, if you take 500 nT at 16.7 Hz plus 1000 nT at 50 Hz, a simple addition will amount to 1500 nT, whereas the quadratical addition (= “All3D”) will amount to only 1118 nT. The 16.
What is the purpose of the individual files and where are they saved? “CONFIG.NFA” -> user configurations of the NFA-> SD-card “NFAsoft.ini” -> Presettings for NFAsoft -> same folder as NFAsoft “FIRMWARE.NFA” -> operating system of the NFA -> SD-card 9-Point-Measurement of the electric field (“E3D”)… … in an (almost) field-free area: the indication of the dominant frequency is unpredictable.
The grounding cable plug slips out of the jack, or there is a loose connection The plug is inserted too far into the isolating material, so there is no connection Solution: Hold on to the middle part of the contact on the plug with a tong, and screw back the isolation material WRONG Correct Streaks and “scratches” on the display foil? In order to assure a high resolution potential free measurement of the E-field, a highly sensitive foil of a vapour deposited metal layer has had to be mounted onto the di
Hersteller / Manufacturer / Fabricant / Fabricante: Gigahertz Solutions GmbH Am Galgenberg 12 90579 Langenzenn Germany Tel : +49 (9101) 9093-0 Fax : +49 (9101) 9093-23 www.gigahertz-solutions.de … .com / ... .fr / … .es / ... .