
User Manual


Appendix: Electrical Safety
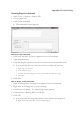
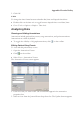
Viewing Transit Times
x Click on the toolbar.
x Select View > Test Summary
The Test Summary screen appears. Transit times computed using the physician-
defined markers appear on the left and MotiliGI-computed markers appear on the
right.
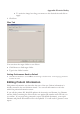
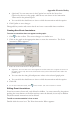
Calculating Statistics
To enter the Statistics mode:
1. Click on the toolbar. The cursor changes to .
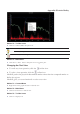
2. Click and drag to select any area of the graph.
A yellow box appears around the selected area and creates a range. The Statistics
panel displays pressure, pH and temperature statistics for the range.
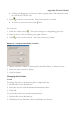
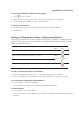
To save the range as an annotation on the graph:
1. On the statistics panel, click Save Annotation. The Range Annotation Editor
screen appears.