
User Manual


Appendix: Electrical Safety
Set Gastric Emptying Marker
Set ICJ Marker
Set Body Exit Marker
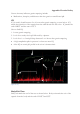
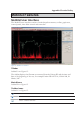
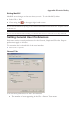
Graph Area
Labeled D on Figure 13.
The graph area presents plots of pressure, pH, and temperature data captured
throughout the test, and point and range annotations.
The left Y-axis is the pressure scale, the right Y-axes are pH and temperature scales,
and the X-axis is the elapsed time of the test.
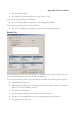
Data Panels
Labeled E on Figure 13.
MotiliGI’s two data panels, positioned to the right of the graph area, provide
information and controls related to test “Statistics” and graph “Location.”
To show or hide the data panel:
► Double-clicking the bar between the graph and the data panels.
Time Slider Control
Labeled F on Figure 13.
The time slider control shows what appears in the main graph in relation to the entire
test.
Display Tabs
Labeled G on Figure 13.
Navigate between the Graph (statistics panel), Help (user manual) and Analysis Wizard
(not pictured).
To show or hide the data panel:
► Double-clicking the bar between the graph and the data panels.
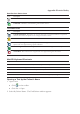
Status Bar
Labeled H on Figure 13.
The status bar displays the username, and data receiver and test status icons. MotiliGI
uses 7 icons to indicate the status of the data receiver and test.