
User Manual


Appendix: Electrical Safety
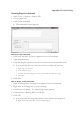
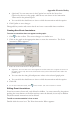
1. To access the patient information either:
x Click on the toolbar
x Click View > Patient Info.
2. Edit the patient’s information.
3. Click OK.
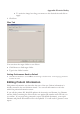
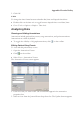
Changing the Graph Display
Selecting Data Plots
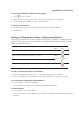
MotiliGI gives you 3 methods to select the data (pressure, pH and temperature)
displayed on the graph:
Method 1 ± Context Menu
x Right-click on the graph and select a data plot. A checkmark indicates the
plot appears on the graph.