
User Manual


Appendix: Electrical Safety
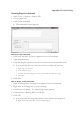
x Clicking and dragging your mouse to select a graph region (This method zooms
in on both the X and Y axis)
3. Click to exit the zoom in mode. The cursor returns to normal.
x To return to your last view use the icon.
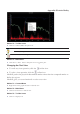
To zoom out:
1. From the toolbar, select . The cursor changes to a magnifying glass icon.
2. Select an area to view by clicking on a graph location.
3. Click to exit zoom out mode. The cursor returns to normal.
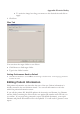
Method 6 ± Using the Data Panel: Location
1. Define a window of time by selecting Start and End Times or Time In Center
2. Enter the time you wish to display.
3. Click Set Graph.
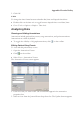
Changing Axis Scales
Y Axes
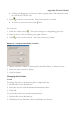
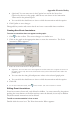
To change the scale of the pressure, pH or temperature axis:
1. Double-click on the desired axis.
2. Enter the new axis scale minimum and maximum values.
3. Click OK.
To restore the scale to the saved user preferences:
1. Double-click on the desired axis.
2. Click Restore Axis Defaults or Restore Defaults for All Axes.