
Operation Manual


7-1
CHAPTER 7
View Event Data
Overview
Types of data
display
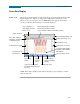
PX5 offers a graphical, information-packed, and easy to navigate display of event data.
The firmware architecture of PX5 is designed to engage in various stages of
acquisition, characterization, communication, and visualization of event data and
journalled data. PX5 also does Quality of Supply or QOS compliance monitoring as
specified by EN50160, which requires that measurement parameters must be within a
specified percentage for 95% of the time.
Event
: An event occurs when a programmed threshold is crossed. An event consists of
pre-trigger cycle(s), trigger cycle (fault), and post-trigger cycle(s). A contiguous
collection of cycles caused by events is recorded into memory. An event may also
contain information about other channels depending on how the user sets up the
application.
Trend
: A trend is a graph of the value of one parameter and channel over time. Trends
aim to show a macro view interface of timespan, trigger conditions, and channels of
waveforms and rms that were recorded. Users can zoom in on trends for a more
detailed view.
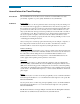
View data icons
The Events and Trend icons are used to view event data. Both icons are accessible at
the Home page.
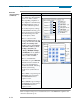
The Events button will display event activity graphs, waveform display, event Detail
magnification, and Options to change and/or add parameters/channels to plot. Buttons
to view previous/next event and waveform/rms cycle display are also available.
NOTE: Event data becomes available while the instrument is monitoring or by loading
a previously saved file from the data card. Otherwise, a status message appears
indicating that there are no event data available to view.
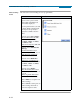
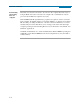
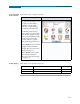
The Trend button displays time plots or trend visualizations of journalled data. The
parameters to plot consist of journal entries under the Journal Limit Setup (see pages
6-18 to 6-20). The Trend screen can display up to four plots, with a maximum of two
parameters per plot. One parameter can have multiple channels to plot. Users have the
option to enable/disable plot display, where display area will resize according to the
number of plots enabled for display. The Trend screen also features a Zoom box, where
users can expand or narrow the zoomed area via touch and drag. Users can select the
trend coordinates to view in detail.