
Operation Manual


7-4
Overview
Section A
Events
Overview
What is
displayed?
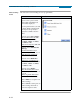
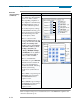
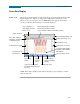
The event screen displays actual voltage or current waveforms that occurred when a
certain threshold parameter was crossed. Event activity graphs, event list, waveform
display, rms display, and time plots are visually interfaced showing event patterns and
behaviors over threshold limits and time. The event screen also enables users to
customize data plots, allowing users to change and/or add parameters/channels for each
of the four plot areas. Zoom box features, wherein users can expand or narrow the size
of a zoomed area via touch and drag, are also available for more thorough data analysis
and interpretation. Users can select the number of waveform and rms cycles to view, as
well as display event textual summary as shown on pages 7-9 thru 7-13.
In this section
The following topics are covered in this section.
Topic See Page
Event Data Display 7-5
Event Activity Graph 7-6
Event List 7-7
Event Detail 7-9
Event Options 7-14