
Operation Manual

SECULIFE ESPRO
14 GMC-I Messtechnik GmbH
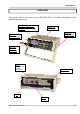
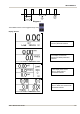
MAIN SCREENS – There are 7 main screens, 5 Display Screens which have 1, 2, 3, 4 and 5 display
zones respectively, a Measurement List Screen which shows available measurements and the Quick
Config Screen which displays the current hardware configuration. In the Display Screens, each Display
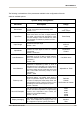
Zone can be customized to show the desired parameter from the following options:
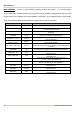
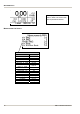
Parameter Abbreviation Description
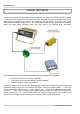
mV RMS mV This is the mV measured directly from the RF donut.
mA RMS mA
This is the converted mA measurement based on the RF donut
mV to mA attenuation ratio.
Power in Watts Watts
This is the computed power based on load setting and mA
measured.
mV Peak mV Pk
This is the maximum mV measured in the buffer.
NOTE: This is shown as absolute value.
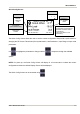
mV Peak - to - Peak mV P-P
This is the difference between maximum mV measured and
min mV measured.
mV Peak /
Peak - to - Peak
Pk/P-P
This is the ratio of Peak versus
Peak to Peak millivolts.
mV Positive Peak Only mV Pk+
This is the maximum positive mV measured in the buffer. For
asymmetric waveforms this can determine if the output polarity
is reversed.
Crest Factor CF This is the ratio of peak to rms of the measured waveform.
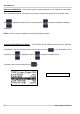
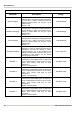
Time Pulse - On Ton
This is the duration that the pulsed waveform is on.
(See Diagram 1)
Time - Pulse Off Toff
This is the duration that the pulsed waveform is off.
(See Diagram 1)
Time - Total Cycle Tcyc
This is the total cycle time of the pulsed waveform
(i.e. Ton + Toff). (See Diagram 1)
% Duty Cycle %Duty
This is the ratio of the pulse on time (Ton)
versus cycle time (Tcyc). (See Diagram 1)
mV Pulse mV cyc
This represents the RMS mV over one pulsed cycle.
(See Diagram 1)
mA Pulse mA cyc
This represents the RMS mA over one pulsed cycle.
(See Diagram 1)
Watts Pulse Wcyc
This represents the RMS Watts over one pulsed cycle.
(See Diagram 1)