
Operation Manual


SECULIFE ESPRO
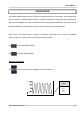
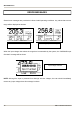
GRAPH MODE
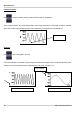
The GRAPH MODE allows the user to view the measured waveform in the display. The horizontal axis
can be zoomed in to display higher frequency waveform components. The vertical axis is auto-scaling
and cannot be adjusted. Any of the stored waveforms can be graphed. Additionally, if the unit is placed in
the HOLD MODE, the user can adjust which portion of the waveform is being displayed.
NOTE: Due to the limited number of pixels in the display, this should not be used as a calibrated
reference, rather as a quick check of the waveform being measured.
Use to enter the GRAPH MODE.
Use to exit the GRAPH MODE.
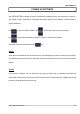
Selecting a Waveform
Use to select the waveform to be graphed, Ram or Location 1-3.
Waveform
Location
RAM
L1
L2
L3
GMC-I Messtechnik GmbH 35