Operating Instructions GL SpectroSoft Operation And Evaluation Software 1/06.
Thank you for selecting this state of the art GOSSEN product. We hope you are enjoying the easy operation, the high quality, precision and wide functionality. GL SPECTROSOFT BASIC is an operation and evaluation software for MAVOSPEC with standard functionalities. GL SPECTRASOFT BASIC standard functionality: Spectral power distribution – graphic display of the spectrum with scaling function and assignment of colors to wavelengths.
GL SPECTROSOFT PRO is an operation and evaluation software for MAVOSPEC with an enhanced range of functions. It includes all of the GL SPECTROSOFT BASIC functions. GL SPECTRASOFT PRO enhanced functionality: LED binning – brightness and color bins can be set up with the integrated editor. LEDs are assigned to the predefined classes during measurement. Indices of metamerism – are ascertained for the UV and visible ranges.
Contents Page 1 1.1 1.2 Introduction System Requirements License Types 2 2.1 2.1.1 2.1.2 2.1.3 2.2 Installation Connecting Devices GL SPECTROSOFT for GL SPECTIS GL SPECTROSOFT for MAVOSPEC GL SPECTROSOFT with many Devices Changing or Extending License 7 8 9 9 9 12 3 Startup 15 4 4.1 Basic Functions Tool Bar Serial Measurements 16 17 5 5.1 5.2 5.3 5.4 5.5 Top Menu Options File ISO 3664 Assessment Edit Action Window 19 19 20 21 22 22 6 6.1 6.2 6.3 6.4 6.5 6.
1 Introduction GL SpectroSoft is optional evaluation software with an intuitive user interface and extensive measuring functions for the spectral analysis of light sources, as well as transmission and reflection measurements. Spectral values measured with the MAVOSPEC and the respectively required accessories, as well as externally generated spectra, can be evaluated in accordance with current CIE standards.
1.2 License Types The GL SPECTROSOFT software is available in three versions: BASIC, PRO and LAB. You can also extend the PRO version with individual functionalities available in the LAB version. You can extend and change versions by adding appropriate licence keys.
LAB Transmission, Reflection This software option can be used for transmission or reflection measurements of optical components. Enables to take reference measurement and then make T or R measurement of the sample with the use of external light source and optical accessories. Scotopic / Photopic Option for calculating S/P values TIMER/SERIAL Product – No. Setting of the automatic measurements schedule. Set RELATIVE measurements comparison Product – No.
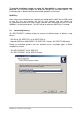
To start the installation simply run setup GL_SpectroSoft v----.exe program from your CD. The installation program will guide you through the installation process. The installation path is determined to enable remote upgrades in the future. HASP Key After successful installation of the software you should put the HASP key to USB socket in your PC. This unit contains the key for your software and you cannot use GL_SpectroSoft without that.
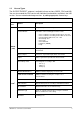
2.1.1 GL SPECTROSOFT for GL SPECTIS Only GL_Spectrosoft is installed when you want to use devices using SPX Driver (GL SPECTIS 1.0, GL SPECTIS 8.0). SPX driver must be installed in addition. Software is set to work with SPX Driver devices. 2.1.2 GL SPECTROSOFT for MAVOSPEC GL_Spectrosoft and Androdi USB Driver is installed. This instalation type set software to work with Androdi USB Driver devices MAVOSPEC via USB cable. 2.1.
3. MAVOSPEC - WiFi - connect via WiFi Driver TCP connection via WiFi. Set IP address of a MAVOSPEC device from Settings (e.g 10.0.6.123 on the screen below).
4. MAVOSPEC - USB - connect via Android USB Driver The connection is done via USB cable. Android USB driver must be installed.
2.2 Changing or Extending License Select File->Licence from main menu to extend software functionality with a licence key. Change License Version To change the version of your software (e.g. when you want extend from the Basic version to Pro) : 1. Copy the license version code to the License key field or load it from a file using Load from file button. 2. Press OK button below to accept. 3. Restart the software. After the software restarts, the new version is available.
Additional Function License To add new functionality to your software: 1. Connect the device and make at least one measurement. 2. Generate a request code - request code appears in the Request code field. 3. Save the request code with the Save to file button and send it to your reseller. 4. Get an additional function code from your reseller and load it with Load licence from file (a code should appear in the Additional function code field) 5. Add a licence key with the Add licence keybutton. 6.
3 Startup Measurement and analysis using GL SPECTROSOFT Startup 1. Connect your measuring instrument with USB cable to your computer. 2. Start the SPX driver Software (only when use Spectis touch 1.0 or 8.0). 3. Select a device type in File->Settings (default device depends on the device you choose during installation). 4. Insert the HASP USB Key, and wait several seconds for the system to install the key. 5. Now you can run the GL SPECTROSOFT.
4 Basic Function Tool Bar The different functions are accessible depend on the version / license of the program. 1. 2. 3. 4. 5. 6. 7. 8. 9. 10. 11. 12. 13. 14. 15. 1. Open: previously saved measurements can be open, 2. Save group: all currently open / active measurements can be saved in one file 3. Zoom max optimizes the view of the whole spectrum chart in the current window size.
11. Transmition/Refectance mode This mode allows to make comparative measurements. Reference mesurement is triggered using REF button. Next measure triggered with M button is compared with the reference measurement and signal data are shown as a percent of referens signal. 12. Background mark a current measurement as a ambient light measurement. Next user can using context menu substract selected background signal from another measurement to compensate ambient light.
4.1 Serial measurements 1. Start/stop serial measurements 2. Interval between measurements 3. Measurements count GL_SpectroSoft allows to program the serial measurements with defined interval and measurements count. 1. Continuous button starts/stops continuous and serial measurements. Continuous measurement (when interval and count is set to 0) triggers the measurements one after the other and shows spectrum on the same chart.
GOSSEN Foto- und Lichtmesstechnik GmbH 18
5 Top Menu Options In the upper left corner of the screen you will find the access to remaining menu functions. 5.
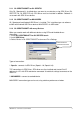
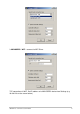
5.2 ISO 3664 Assessment ISO 3664 assessment - it is a measuring procedure according to ISO 3664:2000 norm for Viewing Conditions in the Graphic technology and photography. Note: before you start this procedure set the measurements parameters for integration time and number of repetitions 1. To start the procedure go to top menu and click File, ISO 3664 and the following dialog box will appear: 2. Accept this box and proceed to determine the illuminated surface area. 3.
4. Place the GL SPECTIS 1.0 in the shown place and Click the icon twice to make measurement. The program sets the next measurement location in which to place the spectrometer and measure. Proceed untill the procedure is finished. 5. After completing the measurements in all set locations the result dialog box will appear with indication of test results. 6. After completion of the measurement procedure you can generate the report. To do this, click the Report at the bottom of the measurement. 5.
5.4 Action See basic functions tool bar 5.
6 Measurements Result Windows 6.1 Measurement Measurement includes the results for each wavelength. Use the drop-down menu to select the presentation of results at specific intervals: Native – the source data as 1nm, 2nm and 5nm; 6.
6.
6.4 Chart Chart window is a set of graphs representing chromacity diagrams determined by the CIE. Bookmarks allow you to select a particular chart type. 6.5 Selected results A very convenient perspective of results preview is selected results window. To make this window visible right click on the tool bar and check "Selected results". Now selected results window is visible and you can see a set of the most important measurement parameters.
Now you can select template containing set of parameter which will be shown in the selected results window. Templates are stored in "C:\GL Optic\GL_Spectrosoft\tables\results" directory and are standard text files with codes of parameters which have to be presented each in a new line. A separator empty lines are allowed. Sample "XYZ.
X2 Y2 Z2 X10 Y10 Z10 The list of codes which can be used in selected results template file (depending on version): x2, y2, u2', v2', L2, a2, b2, X2, Y2, Z2, x10, y10, y10, u10',v10', L10, a10, b10, X10, Y10, CCT, ChErr, ColPeak, ColPeakVal, ColDom, Purity, Radiometric, PAR, Ra, R1, R2, R3, R4, R5, R6, R8, R9, R10, R11, R12, R13, R14, Mivis, Miuv, Binning, Brightness. Codes corresponds with parameters which are presented in results window.
6.6 Comparison Table Comparison table allow to compare spectrometric values of many measurements in one table. This useful tool equips user with standard functions as designing custom sets of values, data sorting, export to text file (tab-separated values format) to use in a thirdparty software (e.g. a calculation sheet ). Context menu (right mouse button) allows to call functions connected with the comparison table.
7 TOOLS 7.1 Bin Editor Binning groups can be defined by Bin Editor tool (Tools->Bin Editor) In the first tab user can defain xy criterions. Each row is definition for one polygon which determines location of x, y parameters. Columns meaning: 1. Name of a group. 2. x coordinate of the first point of the polygon. 3. y coordinate of the first point of the polygon. 4. x coordinate of the second point of the polygon. 5. y coordinate of the second point of the polygon, and so on. 6,7. The third point. 8,9.
Definition of binning groups may be saved to or load form a text file. Software always use the last used group which path is shown above the table. Sometimes it's easier to edit or import binning groups directly to a text file. Sample text file structure is presented below: 5U 6U 7U 8U 0.437 0.442 0.448 0.443 0.442 0.447 0.453 0.448 0.447 0.451 0.458 0.453 0.451 0.456 0.462 0.458 0.389 0.398 0.400 0.391 0.398 0.408 0.409 0.400 0.408 0.417 0.418 0.409 0.417 0.426 0.427 0.
Brightness groups are stored in similar way. You can edit them, save and load using the second tab in Bin Editor. Columns meaning: 1. Name of a group. 2. Brigthness minimum value. 3. Brigthness maximum value. Sample text file structure is presented below: JZ 61 71 KX 71 82 KY 82 97 KZ 97 112 Names and values in the file are separated by the tab character. Last selected set is stored in the file C:\GL Optic\GL_Spectrosoft\default\brightness.plp.
When binning and brightness groups are defined, the appropriate names are presented in results window and comparison table for each measurement.
7.2 Pass/Fail Editor Pass/Fail tool (Tools->Pass/Fail Editor) allows to define user conditions which light should meet and should be checked after a measurement. Prepare conditions or open previously prepared and turn on pass/fail function. Turn on/off pass/fail check Setrange (min-max ) Selectsthe parametersto be monitored Use current measurement as a reference signal and find similar with defined tolerance.
After measurement in results window and comparison table pass/fail check results are presented. Each parameter which was selected to monitoring is shown as a: - green - when meets conditions, - red - when does not meet conditions, what provides user with detailed information which parameters do not meet selected conditions. Additionally Pass/Fail parameter shows the overall result of the test (PASS/FAIL). Using this parameter and the comparison table user can divide or compare measurements in an easy way.
8 Reports A report template is a text file in HTML format. It can be created in any text or HTML. A generated report is opened in default HTML browser. 9 Practical Notes Make sure that the integration time is properly matched to the level of the tested source. The best results are obtained by measuring between 40% and 90% signal level. The value of the signal is visible on the top bar after each measurement. If recommended conditions and time of measurement allows set repeated measurements.
Printed in Germany – Subject changed without note GOSSEN Foto- und Lichtmesstechnik GmbH I Lina-Ammon-Str.22 I D-90471 Nürnberg I Germany Telefon: +49 911 8602-181 I Fax: +49 911 8602-142 I E-Mail: info@gossen-photo.de www.gossen-photo.