
User's Manual


7 / 56 ZONESCAN net
Version 1.4
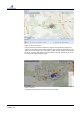
Figure 2 Structure
1 Map area The Map area contains a Google Maps map with
the area of the selected project.
Use the buttons located above the map to
execute various functions which vary depending
on "2 View" (Leak Detection or Maintenance). For
an explanation of the individual functions, hold the
cursor over the button.
The buttons in the upper part of the map can be
used to display and hide individual elements of
the map. Depending on "2 View" (Leak Detection
or Maintenance), the Correlations, Leak Values
and Custom or Alpha, Repeater, Logger and
Custom fields are displayed. Changes made here
affect the view in "6 List Area".
By default, a legend is displayed in the lower part
of the map.
2 View In View, the user can switch between Leak
Detection, Maintenance and Administration. Use
the Printer drop-down menu to print the screen,
the map, correlated leaks or the leak values.
3 Project In the Project menu bar, the user can select the
desired project via the drop-down menu.
4 Measurement
Period
The measurement period can be changed in the
drop-down menu. Select from 5 days, 30 days or