
Sigma 900 MAX Refrigerated Sampler Instrument Manual


Page 114
Programming Features
8990apdx_pfeatures.fm
Appendix B
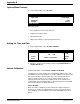
Selecting the Channel
Note: Only the channels for
which logging has been enabled
will be listed.
1. Press DISPLAY DATA from the Main Menu to display a list of logged
channels.
2. Highlight the desired channel using the
UP and DOWN keys then press
SELECT.
Tabular or Graph Format
1. Highlight the desired display method using the UP and DOWN keys then
press
SELECT.
11:00 AM 21 - APR - 01 DISPLAY DATA
SELECT
FLOW
RAINFALL
RETURN
PH
11:00 AM 21 - APR - 01 DISPLAY DATA
SELECT
DISPLAY DATA
DISPLAY BY GRAPH
RETURN
Table 22 Display Data Functions and Descriptions
Function Description
Display Data by Table
View from start: Displays the data for the selected channel beginning with the first (oldest) data point in
memory.
View from end: Displays the data for the selected channel beginning from the most recent point in memory.
View from time/date: Displays the data for the selected channel beginning from any desired time and date.
Enters a new desired time and date.
Note: Totals displayed are calculated by summing the logged data. If the date selected precedes available
logged data (memory has wrapped), the total will be incorrect.
Display Data by Graph
Graph day: Displays data for a specified date. Data for the selected date is graphed from midnight to midnight.
Graph point in time: Displays data for a specified time and date. The graph displays three hours of data with
the selected point in the time at the corner of the graph.
Graph partial day: Zooms in on a portion of the logged data.