
User manual

67
Advanced Operations
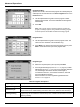
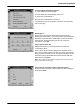
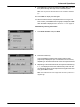
2. To enter the standard concentrations and corresponding
absorbance values in the displayed table, press the "+" symbol.
Use the alphanumeric keypad to enter the values.
Press OK and enter the corresponding absorbance value.
Press OK.
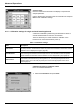
The entered data are displayed in the table. Repeat the
sequence for each data point to enter it.
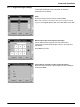
3. To change a value in the table, highlight the appropriate line,
press the unit key (e.g. mg/L) or Abs and enter the changed
value via the alphanumeric keypad.
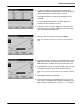
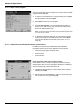
4. When the data have all been entered, press Graph.
Note: The correlation coefficient (r
2
) is shown on the left below the
axes.
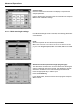
5. The linear equation corresponds to the standard setting. Press
Next Curve to display the polynomial 2nd order curve. Press
Next Curve again, to display the polynomial 3rd order curve.
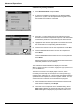
6. Press Force 0 to change the setting from Off to On. The curve
now passes through the origin of the coordinate system.
Note: This may have an adverse effect on the correlation coefficient
(r
2
).
7. Press Table to display the table again.
8. When the table has been completed and the curve type has
been chosen, press Done when the graph is displayed or Exit
when the table is displayed. Go to section 6.1.1.4 on page 70.