
User manual

86
Advanced Operations
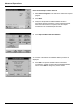
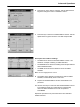
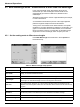
11. After all the standard addition solutions have been measured,
press Graph.
The regression line through the standard addition data points is
displayed.
The correlation coefficient r
2
indicates how close the data
points are to the line.
If the correlation coefficient = 1, the curve is linear.
The concentration shown above the curve is the estimated
concentration of the sample without the added standard.
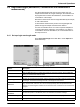
Note: In the curve menu, the name on the Curve key switches to
Table. Press Table to display all the data in the table again.
12. Press Ideal line to display the relationship between the added
standard solutions and the ideal line (detection rate 100%).