
User Manual
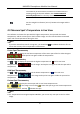
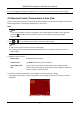
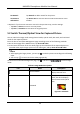
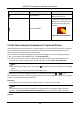
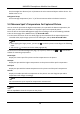
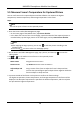
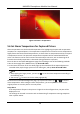
Table Of Contents
- Chapter 1 Introduction
- Chapter 2 Download the Mobile Client
- Chapter 3 Log in to Device
- Chapter 4 Live View
- Chapter 5 Picture and Video Management
- 5.1 View Pictures
- 5.2 Switch Thermal/Optical View for Captured Picture
- 5.3 Set Thermometry Parameters for Captured Picture
- 5.4 Measure Spot's Temperature for Captured Picture
- 5.5 Measure Frame's Temperature for Captured Picture
- 5.6 Set Alarm Temperature for Captured Picture
- 5.7 Set Palettes for Captured Picture
- 5.8 Generate Report
- 5.9 View Videos
- 5.10 Share Pictures and Videos
- 5.11 Delete Pictures and Videos
- Chapter 6 Local Settings
- A. Common Material Emissivity Reference

HIKMICRO Smartphone Module User Manual
14
5.5 Measure Frame's Temperature for Captured Picture
You can set frames on the captured picture and the software can measure the highest
temperature, lowest temperature, and average temperature in the frame.
Steps
Note
You can set up to 3 frames on the captured picture.
1. Enter the Picture and Video Management page.
– On the home page of the Mobile Client, tap Picture & Video.
– In the lower-left corner of the Live View page, tap the thumbnail of the captured picture or
recorded video, tap the larger picture or the video again, and tap Enter Picture & Video.
Note
● After tapping the larger picture, you can tap to edit the picture according to the
following steps.
● You can tap to return to the Live View page quickly.
2. On the Picture and Video Management page, tap a picture, and then tap
to enter the
editing mode.
3. Tap → on the toolbar to set a frame on the captured picture.
4. Optional: Edit the frame.
Move Frame
Drag the frame to move it.
Delete Frame
Tap Delete above the frame to delete it.
Adjust Shape and
Size
Drag a vertex of the frame to adjust the frame's shape and size.
You can also spread fingers apart and pinch them together inside the
frame to adjust its shape and size.
5. Tap areas outside of the frame on the picture to confirm the frame settings.
The highest temperature, lowest temperature, and average temperature in the frame will be
displayed. The blue point represents the spot with the lowest temperature, and the red point
the spot with the highest temperature.