
User Manual
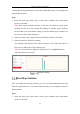
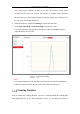
Table Of Contents
- Chapter 1 System Requirement
- Chapter 2 Network Connection
- Chapter 3 Access to the Network Camera
- Chapter 4 Wi-Fi Settings
- Chapter 5 Live View
- Chapter 6 Network Camera Configuration
- Chapter 7 Network Settings
- 7.1 Configuring Basic Settings
- 7.2 Configure Advanced Settings
- 7.2.1 Configuring SNMP Settings
- 7.2.2 Configuring FTP Settings
- 7.2.3 Configuring Email Settings
- 7.2.4 Platform Access
- 7.2.5 Wireless Dial
- 7.2.6 HTTPS Settings
- 7.2.7 Configuring QoS Settings
- 7.2.8 Configuring 802.1X Settings
- 7.2.9 Integration Protocol
- 7.2.10 Bandwidth Adaptation
- 7.2.11 Network Service
- 7.2.12 Smooth Streaming
- Chapter 8 Video/Audio Settings
- Chapter 9 Image Settings
- Chapter 10 Event Settings
- 10.1 Basic Events
- 10.2 Smart Events
- 10.2.1 Configuring Audio Exception Detection
- 10.2.2 Configuring Defocus Detection
- 10.2.3 Configuring Scene Change Detection
- 10.2.4 Configuring Face Detection
- 10.2.5 Configuring Intrusion Detection
- 10.2.6 Configuring Line Crossing Detection
- 10.2.7 Configuring Region Entrance Detection
- 10.2.8 Configuring Region Exiting Detection
- 10.2.9 Configuring Unattended Baggage Detection
- 10.2.10 Configuring Object Removal Detection
- 10.3 VCA Configuration
- Chapter 11 Storage Settings
- Chapter 12 Playback
- Chapter 13 Picture
- Chapter 14 Application
- Appendix

Network Camera User Manual
178
different charts.
Steps:
1. Select the report type. Daily report, weekly report, monthly report, and annual
report are selectable.
Note: Daily report calculates the data on the date you selected; weekly report
calculates for the week your selected date belongs to; monthly report calculates
for the month your selected date belongs to; and the annual report calculates for
the year your selected date belongs to.
2. Select the statistics type. People entered and people exited are selectable.
3. Select the start time and click Counting to list the heat map data.
4. Select Table, Bar Chart, or Line Chart to display the results.
If you select the table to list the statistics, there is an Export button to export the
data in an excel file.
Queue Management Statistics
Purpose:
Queue management supports data analysis and report output from multiple
dimensions.
Commonly Used Data Analysis
• To see queuing-up people number of a certain waiting time level in a
queue/region, use queuing-up time analysis, check a target region and set a
waiting time level.
• To compare queuing-up people number of a certain waiting time level in multiple
queues/regions, use queuing-up time analysis, check target regions and set a
waiting time level.
• To compare queuing-up people number of different waiting time levels in
multiple queues/regions, use queuing-up time analysis, check target regions and
set waiting time levels.
• To see the time and duration that a queue stays a certain length in a queue/region,
use queue status analysis, check a target region and set a queue length level.