
User Manual
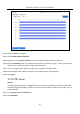
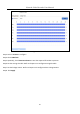
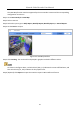
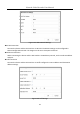
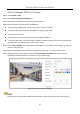
Table Of Contents
- Introduction
- Chapter 2 Getting Started
- Chapter 3 Camera Management
- Chapter 4 Camera Settings
- Chapter 5 Live View
- Chapter 6 PTZ Control
- Chapter 7 Storage
- 7.1 Storage Device Management
- 7.2 Storage Mode
- 7.3 Recording Parameters
- 7.4 Configure Recording Schedule
- 7.5 Configure Continuous Recording
- 7.6 Configure Motion Detection Triggered Recording
- 7.7 Configure Event Triggered Recording
- 7.8 Configure Alarm Triggered Recording
- 7.9 Configure POS Event Triggered Recording
- 7.10 Configure Picture Capture
- 7.11 Configure Holiday Recording and Capture
- 7.12 Configure Redundant Recording and Capture
- Chapter 8 Disk Array (RAID)
- Chapter 9 File Management
- Chapter 10 Playback
- Chapter 11 Event and Alarm Settings
- 11.1 Configure Arming Schedule
- 11.2 Configure Alarm Linkage Actions
- 11.3 Configure Motion Detection Alarms
- 11.4 Configure Video Loss Alarms
- 11.5 Configure Video Tampering Alarms
- 11.6 Configure Sensor Alarms
- 11.7 Configure Exceptions Alarms
- 11.8 Setting Alarm Linkage Actions
- 11.9 Trigger or Clear Alarm Output Manually
- Chapter 12 VCA Event Alarm
- 12.1 Face Detection
- 12.2 Vehicle Detection
- 12.3 Line Crossing Detection
- 12.4 Intrusion Detection
- 12.5 Region Entrance Detection
- 12.6 Region Exiting Detection
- 12.7 Unattended Baggage Detection
- 12.8 Object Removal Detection
- 12.9 Audio Exception Detection
- 12.10 Sudden Scene Change Detection
- 12.11 Defocus Detection
- 12.12 PIR Alarm
- 12.13 Thermal Camera Detection
- Chapter 13 Smart Analysis
- Chapter 14 POS Configuration
- Chapter 15 Network Settings
- Chapter 16 Hot Spare Device Backup
- Chapter 17 User Management and Security
- Chapter 18 System Service Maintenance
- Chapter 19 General System Settings
- Chapter 20 Appendix

Network Video Recorder User Manual
144
The Heat Map function must be supported by the connected IP camera and the corresponding
configuration must be set.
Step 1 Go to Smart Analysis > Heat Map.
Step 2 Select a camera.
Step 3 Select the report type as Daily Report, Weekly Report, Monthly Report, or Annual Report.
Step 4 Set the Data to analyze.
Figure 13-2 Heat Map Interface
Step 5 Click Counting. The results will be displayed in graphics marked in different colors.
As shown in the figure above, red color block (255, 0, 0) indicates the most trafficked area, and
blue color block (0, 0, 255) indicates the less-popular area.
Step 6 (Optional) Click Export to export the statistics report in Microsoft Excel format.