
User Manual
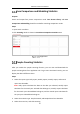
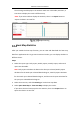
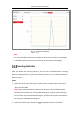
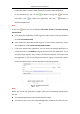
Table Of Contents
- Chapter 1 System Requirement
- Chapter 2 Network Connection
- Chapter 3 Access to the Network Camera
- Chapter 4 Wi-Fi Settings
- Chapter 5 Live View
- Chapter 6 Network Camera Configuration
- Chapter 7 Network Settings
- 7.1 Configuring Basic Settings
- 7.2 Configure Advanced Settings
- 7.2.1 Configuring SNMP Settings
- 7.2.2 Configuring FTP Settings
- 7.2.3 Configuring Email Settings
- 7.2.4 Platform Access
- 7.2.5 Wireless Dial
- 7.2.6 HTTPS Settings
- 7.2.7 Configuring QoS Settings
- 7.2.8 Configuring 802.1X Settings
- 7.2.9 Integration Protocol
- 7.2.10 Bandwidth Adaptation
- 7.2.11 Network Service
- 7.2.12 Smooth Streaming
- 7.2.13 HTTP Listening
- Chapter 8 Video/Audio Settings
- Chapter 9 Image Settings
- Chapter 10 Event Settings
- 10.1 Basic Events
- 10.2 Smart Events
- 10.2.1 Configuring Audio Exception Detection
- 10.2.2 Configuring Defocus Detection
- 10.2.3 Configuring Scene Change Detection
- 10.2.4 Configuring Face Detection
- 10.2.5 Configuring Intrusion Detection
- 10.2.6 Configuring Line Crossing Detection
- 10.2.7 Configuring Region Entrance Detection
- 10.2.8 Configuring Region Exiting Detection
- 10.2.9 Configuring Unattended Baggage Detection
- 10.2.10 Configuring Object Removal Detection
- 10.3 VCA Configuration
- Chapter 11 Storage Settings
- Chapter 12 Playback
- Chapter 13 Picture
- Chapter 14 Application
- Chapter 15 Open Platform
- Chapter 16 Smart Display
- Appendix

Network Camera User Manual
192
The counting result displays in the statistic result area. Click Table, Bar Chart, or
Line Chart to display the result in different way.
Note: If you select table to display the statistics, there is an Export button to
export the data in an excel file.
People Counting
Heat Map Statistics
After you enable the heat map function, you can view and download the heat map
data from application tab. To get more intuitional results, you can display the data in
different charts.
Steps:
1. Select the report type. Daily report, weekly report, monthly report, and annual
report are selectable.
Note: Daily report calculates the data on the date you selected; weekly report
calculates for the week your selected date belongs to; monthly report calculates
for the month your selected date belongs to; and the annual report calculates for
the year your selected date belongs to.
2. Select the start time, and click Counting to list the heat map data.
3. Select Space Heat Map or Time Heat Map to display the results.
If you select the time heat map to list the statistics, there is an Export button to
export the data in an excel file.