
user manual


6.4.3
6 - 61
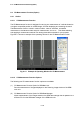
(1) Area Used for CD Measurement
The area in each on-screen box cursor is used for CD measurement. Figure 6.4-6 shows
the relationship between box cursor and measurement parameters. For "Design Value",
specify a distance (µm) between box cursors. The "entire measurement area" is
determined by a combination of parameters. For "Search Area", specify a number of
pixels.
When the distance between box cursors is changed using the mouse, it is automatically
reflected at "Design Value".
(a) Cursor placement for CD measurement (b) Relationship between cursor and
parameters
Fig. 6.4-6 CD Measurement Area
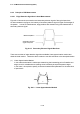
(2) S/N Ratio Improvement and Preparation of Profile
Figure 6.4-7 shows the relationship between a pattern under measurement and its
secondary electron signal. For improving the S/N ratio, take the following procedure:
First, as shown in Fig. 6.4-7 (a), detect secondary electron signals of "N" lines on the
pattern and then overlay these signals. After overlaying, a signal having little variation is
attained as indicated in Fig. 6.4-7 (b). If the number of overlaid lines is insufficient, a
signal having greater variation is provided as shown in Fig. 6.4-7 (c). For "Summing Line",
specify the number of lines to be overlaid as required.
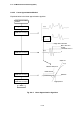
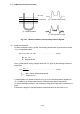
Also, the S/N ratio can be improved by carrying out smoothing based on moving average
operation of secondary electron signals. For "Smoothing", specify a width of moving
average operation. Denoting the "Smoothing" value as N, the relationship between signal
overlaying "p(n)" and signal smoothing "s(n)" is defined by the following expression (6.4.1).
)in(p
N
1
)n(s
L
Li
+
∑
=
−=
.................................................... (6.4.1)
L = (N - 1)/2
In this manner, a signal profile can be prepared.
Design Value
Entire measurement
area
Search Area