
Install Instructions

H7625A, H7635A, H7626A, H7636A SERIES 2000 HUMIDITY/TEMPERATURE SENSORS
Automation and Control Solutions
Honeywell International Inc.
1985 Douglas Drive North
Golden Valley, MN 55422
customer.honeywell.com
® U.S. Registered Trademark
© 2011 Honeywell International Inc.
62-0327—03 S.B. Rev. 11-11
Printed in United States
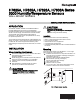
CALIBRATION
NOTE: This is only a single point calibration. All transmitters
are factory calibrated to meet/exceed published
specifications. Field adjustment should not be neces-
sary.
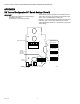
The dipswitch allows the user to calibrate the sensor through
the software. Setting switch 4 ON will put the transmitter into
setup mode allowing the increment and decrement to work.
Once in setup mode, the output will change to 50% (2.5V for
0-5V, 5V for 0-10V, 12mA for 4-20mA). Each increment or
decrement step will cause the output to change by 0.1V for 0-
5V, 0.2V for 0-10V, and 0.32mA for 4-20mA in setup mode.
This can be used to show the user how far offset the
transmitter is. To see the starting point again set switch 1 ON.
This will show the 50% output again. When the unit is out of
setup mode the output will go back to RH output.
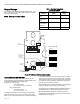
Increment RH Output
This will shift the RH output linearly up in 0.5% steps. Switch 4
must be set to ON first. After switch 4 is on, each time switch 5
is set ON the RH output will increase by 0.5%. The increase
goes into effect each time switch 5 is set to ON.
Decrement RH Output
This will shift the RH output linearly down in 0.5% steps.
Switch 4 must be set to ON first. After switch 4 is on, each
time switch 6 is set ON the RH output will decrease by 0.5%.
The decrease goes into effect each time switch 6 is set to ON.
Reset RH Output
This will reset the RH output back to the original calibration.
Switch 4 must be set to ON first. After switch 4 is on, toggle
switches 5 and 6 ON then OFF. After 5 and 6 are OFF slide
switch 4 OFF.
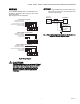
When all calibration is completed, remember to place the
switches back into the positions that correspond to the output
needed as shown in Figure 3.