
Application Guide


63-7062 8
Voltage and Current Waveform Examples
No Load
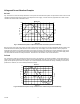
Fig. 4 shows the current and voltage waveforms of one phase of a standard three-phase 10 Hp induction motor under no load
conditions. Full load current of the motor is 13.5 amps from a 415 supply. It is clear from the graph that even under no load
conditions the motor draws substantial current.
V
o
l
t
s
Phase L1
400
300
200
100
0
-100
-200
-300
-400
Time( ms)
0
2018
1614
12108
6
4
2
10
7.5
5
2.5
0
-2.5
-5
-7.5
-10
A
m
p
s
Voltage
Amps
Fig. 4. Standard three-phase 10 Hp induction motor waveforms (no load conditions).
Note the scale on the right of the graph. The peak to peak current is 15 amps. Current lags substantially behind voltage. This
demonstrates that the motor power factor is much less than unity. The majority of the current drawn is for the purpose of
magnetizing the motor and is called
magnetizing current
. Note the shape of the voltage and current waveforms, both curves
should be sine waves. It is likely that the reason for the distorted waveforms is load sharing of the same power supply that is
non-sinusoidal and distorts the voltage waveform. This reflects in the distortion of the current waveform.
Full Load
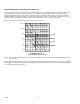
Fig. 5 shows the results of increasing the load on the motor in the test above, to full load conditions. Current draw rose by a
factor of three and the distortion factor has now increased substantially. Note the scale change on the right hand side of the
graph and the peak to peak current is 50 amps. The current waveform moved towards the voltage, indicating an increase in
power factor. However, the current still lags behind the voltage.
V
o
l
t
s
Phase L1
400
300
200
100
0
-100
-200
-300
-400
Time ( ms )
0
2018
1614
12108
6
4
2
25
12.5
0
A
m
p
s
6.25
18.75
- 6.25
- 12.5
- 18.75
- 25
Current
Voltage
Fig. 5. Standard three-phase 10 Hp induction motor waveforms (full load conditions).