
Installation Guide


R7284B,P,U,G ELECTRONIC OIL PRIMARY, ENVIRACOM™ ENABLED
7 69-2467—01
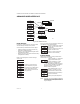
Adjustment of the Burner Off Delay.
Configuration of the TT terminals vs.
an “internal jumper.”
Controls sparking during On Delay
period.
Controls sparking during Run mode
(Interrupted vs. Intermittent ignition).
Number of resets allowed before
Restricted Lockout
Appliance configuration (boiler,
furnace, water heater) for
EnviraCOM™.
Enable advanced diagnostics mode
and error history.
Exit installer setup
If “QUIT” is selected, the user is
prompted with a screen asking if it is
desired to re-baseline the control.
Baselining the control is intended as a means to save
performance data at the time when the control is
operating optimally. The baseline values are a “trend” of
the first 500 cycles following an installation or a command
to “re-baseline” and is provided as a method to compare
present burner performance to that when the burner was
initially installed or serviced. Using the baseline data, it is
possible to monitor the burner system for degradation and
allow a service person to address any issues before they
result in a no-heat situation. After performing the service it
may be desired to reset the baseline through the installer
setup menu.
NOTE: Re-baselining will establish new baseline values
for CAD cell and Ignition Time going forward. It
will also reset the “Cycles Since Baseline”,
“Lockouts Since Baseline”, and “Recycles Since
Baseline” counters back to zero.
Displays the status of the TT and
Limit inputs. Note that “TT Remote”
means EnviraCOM™ is commanding
the R7284 to behave opposite the
status of the TT terminals.
Press “i” to go to the next screen
Current value of the CAD cell. Press
“i” to go to the next screen
If NO is selected, “i” returns to the
home screen
If YES is selected, “i” continues
through diagnostic screens.
The history screens can provide useful information about
the controls past performance, including its recent history
such as cycle trends (using the baseline function) and
total cycles since installation.
View History
From the Diagnostic screen scroll to the View History
screen and select YES. Scroll through the performance
data by using the up or down buttons.
The CAD Cell screen automatically
scrolls 4 screens.
Average CAD cell value during last
cycle
CAD cell trend over the last 10 cycles.
CAD cell trend over the first 500
cycles
Pressing “i” during any of the CAD cell screens moves to
the Ignition Time screens below.
The Ignition Time screen
automatically scrolls through 4
screens.
Last Ignition Time.
Ignition Time trend over the last 10
cycles. Ignition
Time trend over the first 500 cycles.
Pressing “i” during any of the ignition time screens moves
to the Cycle Count screen below.
Total burner cycles.
Burner cycles since last service
(baseline reset).
Flame losses since last service
(baseline reset).
Ignition failures since last service
(baseline reset).
The next press goes back to the View History screen
where the user can exit to the home screen or loop back
through the performance history again.
Error History Screens
For all Error History screens, pressing “i” returns to the
Normal Screen.
From the home screen, press the up button to display
most recent error.
Press the up button again to proceed to the next most
recent error or the down button to return to the previous
error screen.
These three screens transition every 3 sec.
If no more errors are logged, the display shows “Error
History End.”