
user manual

Operating the Analyzer
January 2009 UDA2182 Universal Dual Analyzer Product Manual 23
5.4 Displays Overview
Viewing the Displays
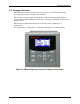
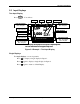
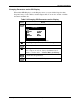
To view display screens, push the
Display
key. Pushing the Display key repeatedly scrolls through
screens which show the current status of pH/ORP, Conductivity, or Dissolved Oxygen
Concentration. There are displays for PID, Auto Cycle, and Pharma. It also lets you view a Status
Display and an Event History Display.
Displays Shown
One Input - When only one input board is installed, the online screen displays one PV and its
units in a larger font size (Section 5.5).
Two Inputs - When two input boards are installed, the online screen displays two PVs and its
units in a smaller font size. Press
to see single PV screens (Section 5.5).
PID - When PID 1 or 2 is active (Section 5.6 ), there is a display screen for each. There is a sub-
screen that allows editing of the Setpoint value, Setpoint Source, Control Mode, and Output
value. You can also enable or disable Accutune and Tune set.
Auto Cycle – When Auto Cycle 1 or 2 is active (Section 5.7), there is a display screen for each.
There is a sub-screen that allows you to start or stop the Cycle.
Pharma – Enabled in Conductivity inputs. Each Pharma screen monitors standard procedure
stages for determining Purified Water. There is a sub-screen that allows you to change the
Pharma Test Stage and adjust the Pct Warning value (Stage 1), Test µS/cm value (Stage 2) and
the Test pH (Stage 3). (See Section 5.8 for details)
Cation Calc – When cation Calc 1 or 2 is active there is a display screen for either cation
or degassed CO
2
measurement. (Section 5.9)
Status Display
- of Alarms Status, PID Alarms Status, Logic Status, Input Status, Output Levels,
Relay States, Monitor Status, Math Values, Aux Values, Variables, Comm Status, System Status,
and Calculated Values. (Section 5.10)
Event History - Event History records events with timestamp. (Section 5.11) Events recorded
include setup change, power on, calibrations (no values) and alarms with detail available on alarm
type and source by scrolling and selecting event name. Status warns of event history at 50% and
90% and when erasing old records.
Contrast Adjustment
When viewing a PV or Control display, you can adjust the contrast by pressing the or key.
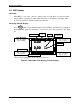
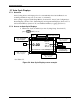
Bargraphs Overview
Output Bargraphs will represent up to three current output values. On the display, the Bargraphs
are the output in Engineering Units. The corner annunciators are the physical relay states (light –
de-energized, dark – energized). The third output and the 3 and 4 relays are shown only when the
source other than NONE is selected.
Menu Indicators
An upward-pointing arrow indicator above the menu at the left end of the header appears when
there are currently menu items above the screen accessible by moving the cursor up.
A downward-pointing arrow indicator below the menu at the left end of the status footer appears
when there are currently menu items below the screen accessible by moving the cursor down.
Use the keys.