
user manual


Operating the Analyzer
January 2009 UDA2182 Universal Dual Analyzer Product Manual 39
Note: The relationship between the electrolytic conductivity and the pH of ammonia and amines is well
established in the technical literature. It must be understood that the UDA was designed for accurate
results over the pH range of 8 to 10.5 based on ammonia or amine chemistries. Other chemistries such as
phosphate or systems that employ alternative anions, such as borate, cannot be expected to realize results
with similar accuracy.
Standardization for cations
The UDA allows for a sample calibration of the cation pH value. Here an independent
sample is withdrawn from the sampling equipment and pH is determined with equipment
of known accuracy. This independent pH value is then entered into the UDA as a pH
calibration constant. To avoid process pH changes during standardization, it is very
desirable to complete the sample extraction, independent measurement and UDA update
as soon as possible.
5.9.4 Calibration
For Calibration procedure, refer to Section 8.7.7 Cation pH Calibration.
5.9.5 CO
2
by Degassed Conductivity
The UDA can be configured for CO
2
determination by degassed conductivity. The cation
conductivity cell is connected to Input 1 and the degassed sample conductivity cell is
connected to channel 2. The UDA performs HCl temperature compensation of both
measurements to 25°C. The difference between the cation and degassed 25°C values is
taken and ppb CO
2
is determined by ASTM D 4519.
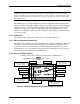
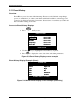
5.9.6 Access to Cation Display
• When Cation Calc is enabled (See Section 6.18 – Maintenance
Configuration), press
Display
until you see:
28.4 ºC
CATION CALC
pH
1
3
4
2
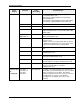
Relay 4 Physical State
White – De-energized
Black - Energized**
Relay 3 Physical State
White – De-energized
Black - Energized**
Relay 2 Physical State
White – De-energized
Black - Energized**
Relay 1 Physical State
White – De-energized
Black - Energized**
9.13
3.772 µS/cm
Output 1 Bar graph
Output 3 Bar graph
0.099 µS/cm
Specific NH
3
Cation HCl
24.1ºC
Output 2 Bar graph
PV 1 Value
PV 2 Value
PV 1 Temperature
PV 2 Temperature
Specific Conductivity
Cation Conductivity
Calculated Water pH
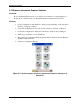
28.4 ºC
CATION CALC
pH
1
3
4
2
Relay 4 Physical State
White – De-energized
Black - Energized**
Relay 3 Physical State
White – De-energized
Black - Energized**
Relay 2 Physical State
White – De-energized
Black - Energized**
Relay 1 Physical State
White – De-energized
Black - Energized**
9.13
3.772 µS/cm
Output 1 Bar graphOutput 1 Bar graph
Output 3 Bar graph
0.099 µS/cm
Specific NH
3
Cation HCl
24.1ºC
Output 2 Bar graph
PV 1 Value
PV 2 ValuePV 2 Value
PV 1 TemperaturePV 1 Temperature
PV 2 TemperaturePV 2 Temperature
Specific Conductivity
Cation Conductivity
Calculated Water pH
Figure 5-7 Cation Display screen example for pH calculations