
user manual


110 CHAPTER 12: REPORT TYPES
Top N Segments
Report
This report calculates the top N segments by utilization, and by
percentage of errors.
For most networks it is sufficient to allow Traffix Manager to select
automatically the top N segments by selecting All Segments for the top N
segments report.
Since it is possible that the top N segments identified by utilization are
different from the top N segments identified by percentage of errors,
Section 2 of this report can contain more than N segment details. If the
high error segments are completely different from the high utilization
segments, you end up with 2 x N details in the details section.
Long Term
Trend
A line chart showing the total octets sent and received
by the device for as long as Traffix Manager has records.
2.1 Top Sub-Groups
With Protocol
Distribution By
Octets
A stacked bar chart showing the top 10 sub-groups
within the detail group, broken down by protocol. The
octet total has the same internal, external or overall
filter as the detail group applied.
3 Report
Information
Information about the report itself.
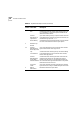
Table 14 Top N Groups Report Charts (continued)
Report
Section
Chart Title Description
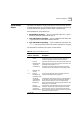
Table 15 Top N Segments Report Charts
Report
Section
Chart Title Description
1.1 Top Segments
By Utilization
A bar chart containing the top N segments as measured
by percentage utilization of bandwidth.
Protocol
Distribution Of
Top Segments
A pie chart showing the top 10 protocols seen across all
of the N segments. If more than 10 protocols are seen,
the remainder are grouped as other.
Protocol
Distribution By
Octets
A stacked bar chart showing the protocol breakdown of
each of the N segments by octets. The order of the bars
is the same as the utilization bar chart. Because
utilization is not the same as octets, the bars in this
chart may not always appear in descending order. For
example, the utilization on a 100Mbps Ethernet
segment may be quite low compared to a 10Mbps
segment, but the octet count may be considerably
higher.
(continued)