
user manual


36 CHAPTER 3: COLLECTING DATA
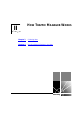
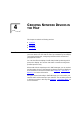
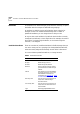
Figure 3 Collected Data is added to a Relational Database
From the collected data, you can build up a picture of normal levels of
network traffic and typical network usage. You can then configure event
rules which provide you with information about the traffic on your
network and network security. When these rules are exceeded, Traffix
Manager generates events which can be viewed in the Map or in graphs.
See Chapter 9
, “Using Event Rules” for more information about
configuring events, and Chapter 8
, “Displaying Traffic in Graphs”.
The contents of the relational database can be retrieved by the Map and
Reporter processes. The Map retrieves data for a given period and
displays it graphically. You can manipulate the display, grouping network
devices and filtering traffic, to view your network in any way you want.
See Chapter 4
, “Grouping Network Devices in the Map” for more
information.
The Reporter uses the same data to generate scheduled reports, which
can then be distributed as HTML files for viewing by a web browser or to
your printer. See Chapter 11
, “Overview of Reporting” for more
information.
Relational
database
ReporterMap
Collector
4 Transport Layer
1 Physical Layer
2 MAC Layer
3 Network Layer
7 Application Layer
5 Session Layer
6 Presentation Layer
RMON-1
RMON-2