
user manual


8
DISPLAYING TRAFFIC IN GRAPHS
This chapter contains the following sections:
■ Overview
■ Using the Graph Panel
■ Using the Launch Graph Dialog Box
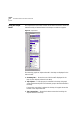
Overview You can use the graph tools in Traffix
™
Manager to analyze mapped
traffic. The graph panel of the main window shows summary information
about the most significant items selected in the Map. In addition to this,
you can open the Launch Graph dialog box to display more detailed
information about selected items.
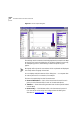
When configuring graphs, consider the following factors:
■ Grouping — Graphs are used to analyze mapped traffic. They are
therefore dependent upon the grouping currently applied in the Map.
Grouping is described in “Groupings”
on page 42. The default
groupings provide good data for basic analysis.
■ Level — Panel graphs are generated for the level currently applied in
the Map only. The level refers to the hierarchy imposed by the selected
grouping, and equates to the attributes in that grouping. For example,
the levels within a geographic grouping could be
country or city. For
launched graphs, you can select different levels from the Graph
Settings dialog box.
■ Connections — You can only generate graphs showing data for
connections displayed in the Map.