
user manual

Overview 91
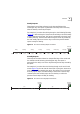
Weekly Reports
These reports use all data collected on the day specified and the
following 6 days. The report is generated in the early hours of the day
after the last day covered by the report.
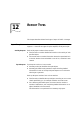
For example, if you select from Friday through to the following Thursday
(Figure 15
), data covering the 7 days from 00:00 Friday to 24:00 Thursday
of the following week is used. The report is generated in the early hours
of Friday morning. Therefore the selected day is the first day covered by
the next weekly report and it is the day on which the previous week’s
report is ready for viewing.
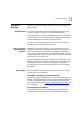
Figure 15 Time Line for Weekly Report Generation
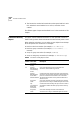
Monthly Reports
These reports use data collected on the specified day of the month and
the calendar month following (including that day). The report is
generated in the early hours of the day following the last day covered by
the report.
For example, if you select from the first day through to the end of each
month (Figure 16
), the raw data for the whole of June (June 1st 00:00 to
June 30th 24:00) is covered by the report. The report is run in the early
hours of July 1st. Again, the selected day of the month is the first day
covered by the next monthly report and it is the day on which the
previous month’s report is ready for viewing.
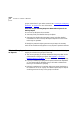
Figure 16 Time Line for Monthly Report Generation
00:00 12:00 24:00 12:00 24:00 12:00 24:00 12:00 24:00 12:00 24:00 12:00 24:00 12:00 24:00
Raw data
generated
Friday Saturday Sunday Monday Tuesday Wednesday Thursday
Raw data
generated
1
July
Raw data
generated
1
June
30 31