
Manual

Show the performance of:
• All Nodes
• Pre-defined Views
Select one of the views from the list. You can create these views on the Configuration tab.
• Most Active (node, library, and tape drive)
Show the storage capacity (total and used) of:
• All Storage Pools
• All Virtual Libraries
• Virtual Libraries per Storage Pool (displays a pie chart instead of a gauge)
• Storage Pools per Virtual Library (displays a pie chart instead of a gauge)
Performance History
The Performance History tab displays a table of performance data for the selected nodes or devices
as designated in the Configuration tab.
To determine which devices display, select one of the following:
• Nodes
• Pre-defined Views, and then select a view from the list
Determine the duration of the data reported in the graphs. Valid entries are whole numbers between
one and 15.
NOTE: The longer the duration you select, or the more nodes or devices your system has, the
longer it may take to generate a report.
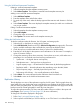
To export the CSV data, enter the number of days to include in the report and click Export. (See
Exporting CSV Data (page 122) for more information on exporting CSV data.) See Figure 27 (page
124) for an explanation of each field in a line of CSV data.
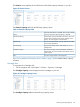
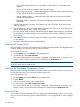
Figure 27 CSV data fields for VLS performance reports
DataItem
Device name1
Node number2
Target/device ID3
Ignore this field4
Writes5
Bytes written/read6
Bytes written/read in last minute7
124 Monitoring