
Quick Start Guide

20 Quick Start Guide
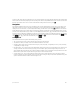
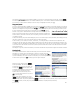
Note that the connectors on the ends of the USB cable are slightly different. The
micro-A connector has a rectangular end and the micro-B connector has a trapezoidal
end. To share objects with another HP Prime calculator, the micro-A connector must
be inserted into the USB port on the sending calculator, with the micro-B connector
inserted into the USB port on the receiving calculator. In some cases,
calculator-to-calculator connectivity might not work; in these cases, use HP Connectivity Kit to transfer the app.
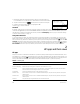
App views
Most HP apps have the same structure, based on the symbolic, graphic, and numeric representations of mathematical
objects. These representations are called views, and they can be displayed by pressing @, P, and N respectively. Each
main view can be configured from an associated setup view. For example, pressing SP displays the Plot Setup view,
where you can specify the range of values to be plotted, axis intervals, cursor appearance, and so on.
Note that an app remains selected until you select another one. Thus, if you leave an app, do other work with the calculator,
and then press @, P, or N, the previous data shown in these views are redisplayed. This includes expressions, plots,
and values.
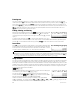
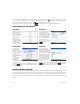
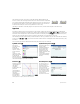
The six primary app views are illustrated below (using the Function app as an example).
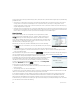
Symbolic view: @
This view is
primarily used to
define the
mathematical
objects—such as
expressions and
open
sentences—that
will be represented
in the Plot and
Numeric views. It is
also used to specify
the statistical analyses you want to undertake.
Symbolic Setup view: S@
This view enables you to
change certain
underlying settings for
the app, such as the
angle measure and
number format. The
settings made here will
override the
corresponding settings
on the Home Settings
window.
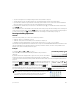
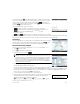
Plot view: P
Displays a graphical
representation of
the objects
selected in
Symbolic view. The
graphical
representations
include graphs of
functions,
statistical plots,
and confidence
intervals. Tap to
trace, swipe to scroll, or pinch to zoom in or out.
Plot Setup view: SP
The first two pages of
this view enable you to
specify the range of
values displayed in Plot
view and to set the
appearance of Plot view.
The third page enables
you to choose an image
for the background and
to determine its
appearance in Plot view.
Micro-A: sender Micro-B: receiver