
Quick Start Guide

22 Quick Start Guide
All the primary variables entered in expressions and open sentences in these apps—X, Y, T, θ, N, and so on—must be
entered as uppercase characters. User-defined variables can be incorporated, and these can be in any case: upper, lower, or
mixed. Thus, if you have created a variable called Cost, you could define a function as X
2
+Cost. (For instructions on how
to create variables, see “Using variables” on page 14.)
Function, Advanced Graphing, Parametric, Polar, and Sequence apps
The Function, Advanced Graphing, Parametric, Polar, and Sequence apps are very similar and can be described together. The
Function app will be used as our sample app.
The Function app enables you to define functions in x, view their graphs, create evaluation tables, and find intersections,
roots, slopes, extrema, etc. To open the Function app, press ! and select Function.
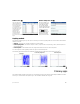
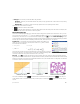
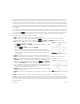
Symbolic view In Symbolic view (@) you can enter up to ten symbolic definitions.
For the Function app, these are functions of x. An example is 2x
2
– 3x + 4.
The functions with a check mark next to them will be plotted in Plot view and tabulated
in Numeric view. Each definition also has a colored box to the left of it. This indicates
the color of the function when it is plotted in Plot view. To change the color shown, tap
twice on the box—once to select it and again to open the color picker—and choose a
color.
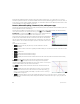
The menu items are as follows:
• —Activates the entry line, where you can add a definition or edit the
selected definition
• —Clears or selects a function for graphing and table-building. (You can also tap a check box to deselect or select
it.)
•—Enters an X
• —Cancels the current addition or change
• —Accepts the current addition or change
• —Displays the selected function in textbook format in full-screen view (with vertical and horizontal scrolling
enabled)
• : Resolves references when one function is defined in terms of another
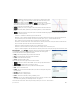
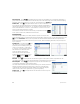
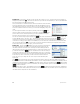
Plot view Press P to display Plot view and see the graphs of the equations
selected in Symbolic view. Plot view allows you to trace a plot, zoom in or out on a plot,
view its symbolic definition, and find various critical values.
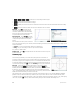
Tap to display (or hide) the full menu for this view. The menu items are as
follows:
• —Displays the Zoom menu, with options to zoom in or out. You can also
quickly square zoom in (and out) on the current cursor position by pressing +
(and :). You can also vertically, horizontally, or square zoom in or out using a
2-finger pinch zoom gesture.
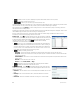
• —Toggles the tracing cursor off and on. With the tracing cursor on, you can press R or L to move a point
along a plot. The coordinates of the point are displayed at the bottom of the screen. Press U or D to jump from one
plot to another.