
Quick Start Guide

Quick Start Guide 37
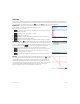
Inference app
The Inference app provides tools for inferential statistics, enabling you to specify
confidence intervals and test hypotheses. Summary statistics from any column in the
Numeric view of the Statistics 1Var or Statistics 2Var app can be imported into it. To
open the Inference app, press ! and select Inference. The app opens in Symbolic
view.
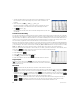
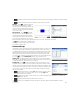
Symbolic view This view provides fields where you can define a confidence interval
or hypothesis test. The fields are as follows:
• Method—Choose hypothesis test, confidence interval, chi-square tests, inference
for regression, or ANOVA
• Type—Choose a specific test or interval distribution based on the T-, Z-, and chi-square distributions
• Alt Hypoth—Choose one of three alternative hypotheses (for hypothesis tests only)
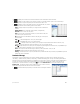
Numeric view Press N to display the Numeric view. This view contains fields
where you can enter sample statistics (for example, sample mean and sample size
n), population parameters (for example, null hypothesis mean μ
0
and standard
deviation σ), and the significance level α. The menu items are as follows:
• —Moves the cursor to the entry line where you can add or change a value
• —Enables you to import statistics (such as , n, and so on) from any
column in the Statistics 1Var or Statistics 2Var app (or any app based on those
apps)
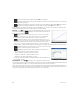
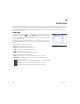
• —Displays the interval or test results
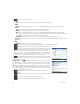
Tap to see the confidence interval or
hypothesis test results and to return
to the Numeric view.
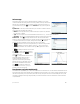
Press P to display the Plot view. This view
graphically displays the test results or
confidence interval. In inference for
regression, the Plot view cycles through
different plot types for the linear t-test. The
Plot view is not available for all methods.
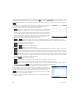
Tap to display the critical score
against the test score. Press D or U to
decrease or increase the α-level.
DataStreamer app (select models only)
The DataStreamer app enables you to collect real-world data from scientific sensors. It works with the HP StreamSmart 410
data streamer and many of the scientific sensors available from Fourier Systems. You could, for example, work with sensors
that detect temperature, pressure, distance, and the like. The app recognizes the sensors automatically and sets up data
streaming, displaying the incoming data graphically as a stream in real time. See the HP StreamSmart 410 User Guide for
complete details.
x
x