
Quick Start Guide

44 Quick Start Guide
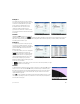
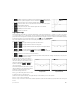
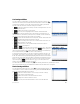
The left half of the display shows the graph of a quadratic function. The right half
shows the general form of the equation being explored (at the top) and, below it, the
current equation of that form. Symbols of the keys you can use to manipulate the
equation or graph appear below the equation. (These are called change keys.) In the
example at the right, the symbols represent the keys R, L, U, D, +, m, and
: (reading from left to right). The active change keys vary according to the graph
being explored and the mode of exploration: graph or equation. Displayed beneath the
symbols of the change keys is the equation, the discriminant (that is, b
2
– 4ac), and the
roots of the quadratic.
You can press S& and tap to reset the app at any time.
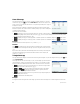
The menu items are as follows:
• —When active—indicated by a dot beside it—you can use the change keys to move between the parameters in
the equation and change their values
• —When active—indicated by a dot beside it—you can use the change keys to directly modify the graph
• —Chooses the increment by which parameter values will change: 0.5, 1, or 2
• —Chooses various forms of equation: there are two in the Linear Explorer and four in the Quadratic Explorer
• —Displays the test view of the app (see below)
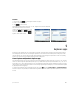
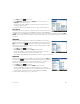
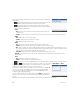
Tap to activate graph mode. In this
mode, you use the change keys to directly
change the position or shape of the graph and
observe the effect on the parameters of the
equation.
Tap to activate equation mode. In this
mode, you use the change keys to directly
select and change the parameters of the
equation and observe the effect on the graph.
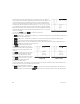
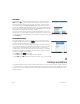
Tap to enter test view. In test view,
you can test your skill at matching an
equation to the graph shown.
Test view is like equation mode in that you use the change keys to select and change the value of each parameter in the
equation. The goal is to try to match the graph that is shown.
The menu items in test view are as follows:
• —Within each level of equation (see below) there are a number of difficult graphs. Tap this button to
cycle through them. A dot on the button ( ) indicates that you are testing yourself on one of the difficult graphs.
Graph mode Equation mode