
User Guide

Page 12-35
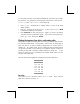
• Press @CANCL to return to the PLOT WINDOW environment. Then, press
$ , or L@@@OK@@@, to return to normal calculator display.
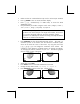
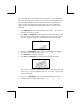
If you could reproduce the slope field plot in paper, you can trace by hand
lines that are tangent to the line segments shown in the plot. This lines
constitute lines of y(x,y) = constant, for the solution of y’ = f(x,y). Thus, slope
fields are useful tools for visualizing particularly difficult equations to solve.
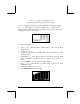
Try also a slope field plot for the function y’ = f(x,y) = - (y/x)
2
, by using:
• Press „ô, simultaneously if in RPN mode, to access to the PLOT
SETUP window.
• Change
TYPE to Slopefield.
• Press ˜ and type ‘− (Y/X)^2’ @@@OK@@@.
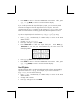
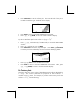
• Press @ERASE @DRAW to draw the slope field plot. Press @EDIT L
@LABEL @MENU to see the plot unencumbered by the menu and with
identifying labels.
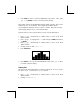
• Press LL@)PICT to leave the EDIT environment.
• Press @CANCL to return to the PLOT WINDOW environment. Then, press
$ , or L@@@OK@@@, to return to normal calculator display.
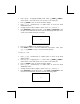
Fast 3D plots
Fast 3D plots are used to visualize three-dimensional surfaces represented by
equations of the form z = f(x,y). For example, if you want to visualize z =
f(x,y) = x
2
+y
2
, we can use the following:
• Press „ô, simultaneously if in RPN mode, to access to the PLOT
SETUP window.
• Change
TYPE to Fast3D.
• Press ˜ and type ‘X^2+Y^2’ @@@OK@@@.