
Reference Guide

3-166 Full Command and Function Reference
PCONTOUR
Type: Command
Description: PCONTOUR Plot Type Command: Sets the plot type to PCONTOUR.
When plot type is set PCONTOUR, the DRAW command plots a contour-map view of a scalar
function of two variables. PCONTOUR requires values in the reserved variables EQ, VPAR, and
PPAR.
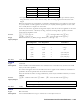
VPAR is made up of the following elements:
{ x
left
x
right
y
near
y
far
z
low
z
high
x
min
x
max
y
min
y
max
x
eye
y
eye
z
eye
x
step
y
step
}
For plot type PCONTOUR, the elements of VPAR are used as follows:
•
x
left
and x
right
are real numbers that specify the width of the view space.
•
y
near
and y
far
are real numbers that specify the depth of the view space.
•
z
low
and z
high
are real numbers that specify the height of the view space.
•
x
min
and x
max
are not used.
•
y
min
and y
max
are not used.
•
x
eye
, y
eye
, and z
eye
are real numbers that specify the point in space from which the graph is
viewed.
•
x
step
and y
step
are real numbers that set the number of x-coordinates versus the number of y-
coordinates plotted.
The plotting parameters are specified in the reserved variable PPAR, which has this form:
{ (
x
min
, y
min
) (
x
max
, y
max
)
indep res axes ptype depend
}
For plot type PCONTOUR, the elements of PPAR are used as follows:
•
(x
min
, y
min
) and (x
max
, y
max
) are not used.
•
indep is a name specifying the independent variable. The default value of indep is X.
•
res is not used.
•
axes is not used.
•
ptype is a command name specifying the plot type. Executing the command PCONTOUR places
the name PCONTOUR in ptype.
•
depend is a name specifying the dependent variable. The default value is Y.
Access: …µ
PCONTOUR
Input/Output: None
See also: BAR, CONIC, DIFFEQ, FUNCTION, GRIDMAP, HISTOGRAM, PARAMETRIC,
PARSURFACE, POLAR, SCATTER, SLOPEFIELD, TRUTH, WIREFRAME, YSLICE
PCOV
Type: Command
Description: Population Covariance Command: Returns the population covariance of the independent and
dependent data columns in the current statistics matrix (reserved variable ΣDAT).
The columns are specified by the first two elements in reserved variable ΣPAR, set by XCOL and
YCOL respectively. If ΣPAR does not exist, PCOV creates it and sets the elements to their
default values (1 and 2).
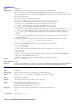
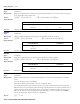
The population covariance is calculated with the following formula:
1
n
---
x
kn
1
x
n
1
–( ) x
kn
2
x
n
2
–( )
k 1=
n
∑
where
x
kn
1
is the kth coordinate value in column
n
1
,
x
kn
2
is the kth coordinate value in the
column
n
2
,
x
n
1
is the mean of the data in column
n
1
,
x
n
2
is the mean of the data in column
n
2
,
and n is the number of data points.