53-1000601-01 19 October 2007 Fabric Watch Administrator’s Guide Supporting Fabric OS v6.0.
Copyright © 2007 Brocade Communications Systems, Inc. All Rights Reserved. Brocade, the Brocade B weave logo, Fabric OS, File Lifecycle Manager, MyView, Secure Fabric OS, SilkWorm, and StorageX are registered trademarks and the Brocade B wing logo and Tapestry are trademarks of Brocade Communications Systems, Inc., in the United States and/or in other countries. FICON is a registered trademark of IBM Corporation in the U.S. and other countries.
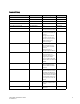
Document History Title Publication Number Summary of Changes Date Fabric Watch User’s Guide 53-0001559-02 New document May 2000 Fabric Watch User’s Guide 53-0000198-02 n/a January 2002 Fabric Watch User’s Guide 53-0000186-02 n/a March 2002 Fabric Watch User’s Guide 53-0000504-02 n/a April 2003 Fabric Watch User’s Guide 53-0000524-02 n/a April 2003 Fabric Watch User’s Guide 53-0000524-03 Updated default values and restructured the document.
iv Fabric Watch Administrator’s Guide 53-1000601-01
Contents About This Document How This Document Is Organized . . . . . . . . . . . . . . . . . . . . . . . . . . . . ix Supported Hardware and Software . . . . . . . . . . . . . . . . . . . . . . . . . . . x What’s New in This Document . . . . . . . . . . . . . . . . . . . . . . . . . . . . . . . x Document Conventions . . . . . . . . . . . . . . . . . . . . . . . . . . . . . . . . . . . . xi Text Formatting. . . . . . . . . . . . . . . . . . . . . . . . . . . . . . . . . . . . . . . .
Notification methods. . . . . . . . . . . . . . . . . . . . . . . . . . . . . . . . . . . . . . 18 Switch event (error) log entry . . . . . . . . . . . . . . . . . . . . . . . . . . . 18 SNMP trap . . . . . . . . . . . . . . . . . . . . . . . . . . . . . . . . . . . . . . . . . . 19 RAPI trap. . . . . . . . . . . . . . . . . . . . . . . . . . . . . . . . . . . . . . . . . . . . 19 Port log lock . . . . . . . . . . . . . . . . . . . . . . . . . . . . . . . . . . . . . . . . . 19 E-mail alert . . . . . . . .
Configuring FRUs. . . . . . . . . . . . . . . . . . . . . . . . . . . . . . . . . . . . . . . . . 50 Configuring Fabric Watch using Web Tools . . . . . . . . . . . . . . . . . . . . 51 Configuring Fabric Watch using SNMP . . . . . . . . . . . . . . . . . . . . . . . 51 Chapter 4 Generating Fabric Watch Reports In this chapter . . . . . . . . . . . . . . . . . . . . . . . . . . . . . . . . . . . . . . . . . . . 57 Types of Fabric Watch reports . . . . . . . . . . . . . . . . . . . . . . . . . . . . . .
viii Fabric Watch Administrator’s Guide 53-1000601-01
About This Document This document is an administrator’s guide to help you use the Fabric Watch product to monitor and improve fabric health. This document is specific to Brocade Fabric OS version 6.0.0 and all switches running Fabric OS v6.0.0. For a list of supported hardware for this release, see “Supported Hardware and Software” on page x.
Supported Hardware and Software This document is specific to Brocade Fabric OS version 6.0.0 and all switches running Fabric OS version 6.0.0, including: • • • • • • • • • • • Brocade 200E Brocade 3250 Brocade 3850 Brocade 3900 Brocade 4100 Brocade 4900 Brocade 5000 Brocade 7500 Brocade 7600 Brocade 24000 Brocade 48000 Although many different software and hardware configurations are tested and supported by Brocade Communications Systems, Inc. for the Brocade Fabric OS v6.0.
Information that was changed or removed: • • • • Updated fan and temperature default threshold values for the Brocade 7500. Updated fan default threshold value for the Brocade 4900. Updated temperature default threshold values for the Brocade 48000. Minor format changes. For further information, see the release notes. Document Conventions This section describes text formatting conventions and important notices formats.
Key Terms For definitions specific to Brocade and Fibre Channel, see the Brocade Glossary. For definitions of SAN-specific terms, visit the Storage Networking Industry Association online dictionary at http://www.snia.org/education/dictionary. Additional Information This section lists additional Brocade and industry-specific documentation that may be helpful.
Brocade 24000/48000 • Port Blade and Filler Panel Replacement Procedure • • • • • • • • Control Processor Blade Replacement Procedure Blower Assembly Replacement Procedure Cable Management Tray and Guide Replacement Procedure Chassis Door Replacement Procedure WWN Bezel and Card Replacement Procedure Power Supply and Filler Panel Replacement Procedure 14U Rack Mount Kit Installation Procedure Mid-Mount Rack Kit Installation Procedure Brocade 7500 • Brocade 7500 Hardware Reference Manual • Brocade 7500 Q
Brocade 3250/3850 • Brocade 3250/3850 Hardware Reference Manual (for v4.x software) • Brocade 3250/3850 QuickStart Guide (for v4.x software) Brocade 200E • Brocade 200E Hardware Reference Manual (for v5.x software) For practical discussions about SAN design, implementation, and maintenance, you can obtain Building SANs with Brocade Fabric Switches through: http://www.amazon.com For additional Brocade documentation, visit the Brocade SAN Info Center and click the Resource Library location: http://www.
Getting Technical Help Contact your switch support supplier for hardware, firmware, and software support, including product repairs and part ordering. To expedite your call, have the following information available: 1.
xvi Fabric Watch Administrator’s Guide 53-1000601-01
Chapter Fabric Watch Concepts 1 In this chapter • Fabric Watch overview. . . . . . . . . . . . . . . . . . . . . . . . . . . . . . . . . . . . . . . . . . . . 1 • Introduction to fabric health . . . . . . . . . . . . . . . . . . . . . . . . . . . . . . . . . . . . . . . 3 • Fabric Watch components . . . . . . . . . . . . . . . . . . . . . . . . . . . . . . . . . . . . . . . . 3 • Configuring events. . . . . . . . . . . . . . . . . . . . . . . . . . . . . . . . . . . . . . . . . . . . . .
1 Fabric Watch overview Fabric Watch lets you define how often to measure each switch and fabric element and to specify notification thresholds. Whenever fabric elements exceed these thresholds, Fabric Watch automatically provides notification using several methods, including e-mail messages, SNMP traps, and log entries.
Introduction to fabric health 1 Introduction to fabric health Fabric health refers to the capability of the fabric to support data being routed through it. A healthy fabric enables effective data transmission between networked devices. Although the concept of fabric health initially seems fairly simple, it can be a deep and complex topic due to the number of factors that are involved. One of the more obvious criteria for fabric health is the condition of the network hardware.
1 Fabric Watch components Table 1 describes the classes into which Fabric Watch groups all switch and fabric elements. TABLE 1 4 Product Name classes Class Description Environment Includes information about the physical environment in which the switch resides and the internal environment of the switch. For example, an Environment-class alarm alerts you to problems or potential problems with temperature, fans, and power.
Fabric Watch components 1 Areas While classes represent large groupings of information, areas represent the information that Product Name monitors. For example, switch temperature, one of the values tracked by Fabric Watch, is an area within the class Environment. The tables in this section describe all of the areas monitored by Fabric Watch, organized by their associated classes. Environment class areas Table 2 lists and describes the Product Name areas in the Environment class.
1 Fabric Watch components TABLE 3 Fabric class areas (Continued) Area Description Segmentation Changes Tracks the cumulative number of segmentation changes. Segmentation changes occur due to: • Zone conflicts. • Incompatible link parameters. During E_Port and VE_Port initialization, ports exchange link parameters, and incompatible parameters result in segmentation. This is a rare event. • Domain conflicts. • Segmentation of the principal link between two switches.
Fabric Watch components TABLE 5 1 Performance Monitor class areas (Continued) Area Indicates Receive Performance The percentage of word frames traveling from the configured S_ID to the D_ID exceeds the configured thresholds. Transmit Performance The percentage of word frames traveling from the configured D_ID to the S_ID; user configuration triggers these messages, so you can use the Transmit Performance area to tune your network.
1 Fabric Watch components NOTE Physical link error counters and statistics (such as link failure count, loss of signal count, and RX and TX performance percentages) are not applicable to VE_Ports. Resource class area Table 7 describes the Product Name resource class area. TABLE 7 Resource class area Area Description Flash Monitor Monitors the compact flash space available by calculating the percentage of flash space consumed and comparing it with the configured high threshold value.
Fabric Watch components TABLE 8 1 Security class areas (Continued) Area Indicates SES Violation An SES violation occurs when an SES (SCSI Enclosed Services) request reaches a secure switch from an unauthorized WWN. SLAP Bad Packets A SLAP (Switch Link Authentication Protocol) bad packets failure occurs when the switch receives a bad SLAP packet. Bad SLAP packets include unexpected packets and packets with incorrect transmission IDs.
1 Configuring events Elements Product Name defines an element as any fabric or switch component that the software monitors. Within each area, the number of elements is equivalent to the number of components being monitored. For instance, on a 64-port switch, each area of the Port class includes 64 elements. Each element contains information pertaining to the description suggested by the area.
Configuring events 1 Continuous event behavior Areas with event behavior types set to continuous trigger events in every sample period until the fabric no longer meets the criteria defined for the event. For example, you can configure Fabric Watch to notify you during every sample period that a port is at full utilization. This information can help you plan network upgrades.
1 Configuring events Threshold values Threshold values are of the following types: • “High and low thresholds,” • “Buffer values” High and low thresholds High and low threshold values are the values at which potential problems might occur. For example, in configuring a temperature threshold, you can select the temperatures at which a potential problem can occur due to both overheating and freezing. You can compare high and low thresholds with a data value.
Configuring events FIGURE 2 1 A buffered data region Time bases Time bases are time periods within Fabric Watch. This configurable field impacts the comparison of sensor-based data with user-defined threshold values. Setting time base to none If you set a time base to none, Fabric Watch compares a data value against a threshold boundary level. When the absolute value of the measuring counter exceeds the threshold boundary, an event is triggered.
1 Configuring events When you set a time base to a value other than none, there are two main points to remember when configuring events: • Fabric Watch triggers an event only if the difference in the data value exceeds the preset threshold boundary limit. • Even if the current data value exceeds the threshold, Fabric Watch does not trigger an event if the rate of change is below the threshold limit. The following examples illustrate each point.
Configuring events FIGURE 5 1 Example without an event Event settings This section describes how Fabric Watch compares a fabric element’s data value against a threshold value to determine whether or not to trigger an event. It describes how a specified buffer zone impacts event triggering.
1 Configuring events FIGURE 6 Above event trigger with buffer zone Below event trigger The Below event trigger generates an event when a data value becomes less than the low threshold boundary. When a buffer is defined, the event will be triggered when the value goes below the lower threshold. A second event will not be generated until the value crosses the buffer region set above the lower threshold.
Configuring events 1 In-between event triggers Fabric Watch event triggers are usually set to notify the user of a warning or failure condition, but there is an exception. You can define the In-Between event trigger to receive a notification of fault recovery. For example, when measuring port performance, crossing the high threshold triggers an Above threshold event, which displays a warning message. The threshold might be crossed for a period so brief that is not a true cause for an alarm.
1 Port persistence Port persistence The data collected in port monitoring can vary a great deal over short time periods. Therefore, the port can become a source of frequent event messages (the data can exceed the threshold range and return to a value within the threshold range). Fabric Watch uses port persistence for a port event that requires the transition of the port into a marginal status.
Notification methods 1 SNMP trap The Simple Network Management Protocol (SNMP) performs an operation called a trap that notifies a management station (a workstation that runs network management applications using SNMP protocol) when events occur. You must configure the software to receive trap information from the network device. You must also configure the SNMP agent on the switch to send the trap to the management station using the agtCfgSet command.
1 Notification methods E-mail alert E-mail alert sends information about a switch event to a specified e-mail address. E-mail alert can send information about any error from any element, area, and class. The e-mail specifies the threshold and describes the event, much like an error message. Use the fwMailCfg command to configure e-mail alerts. NOTE To send e-mail alerts, the switch must be connected to a DNS server. Use the dnsConfig command to configure DNS settings.
Switch policies 1 Switch policies Switch policies are a series of rules that define specific states for the overall switch. Fabric OS interacts with Fabric Watch using these policies. Each rule defines the number of types of errors that transitions the overall switch state into a state that is not healthy. For example, you can specify a switch policy so that if a switch has two port failures, it is considered to be in a marginal state; if it has four failures, it is in a down state.
1 22 Interpreting event messages Fabric Watch Administrator’s Guide 53-1000601-01
Chapter Activating and Accessing Fabric Watch 2 In this chapter • Activating Fabric Watch . . . . . . . . . . . . . . . . . . . . . . . . . . . . . . . . . . . . . . . . . . 23 • Accessing Fabric Watch. . . . . . . . . . . . . . . . . . . . . . . . . . . . . . . . . . . . . . . . . . 24 Activating Fabric Watch Fabric Watch must be activated on each switch individually before use.
2 Accessing Fabric Watch If the Fabric Watch license is not listed, continue to step 3; otherwise, you are ready to use Fabric Watch. 3. Type licenseAdd “key”, where key is the Fabric Watch license key. License keys are case-sensitive, so type the license key exactly as it appears. switch:admin> licenseadd "R9cQ9RcbddUAdRAX" 4. To verify successful activation, type licenseShow. If the license is not listed, verify that you typed the key correctly; if you did not, then repeat step 3.
Accessing Fabric Watch 2 SNMP-based enterprise managers Use SNMP-based enterprise managers to: • • • • Query the MIB variable for individual fabric and switch elements. Query and modify threshold and alarm configurations. Receive alarm notification via SNMP traps. View and configure the mail database. NOTE The following instructions apply to the AdvantNet MIB browser. There may be some variation in the procedures when other MIB browsers are used.
2 Accessing Fabric Watch 5. Navigate down through the tree on the left until you find the Fabric Watch OID information:. Configuration file Use a configuration file to: • Upload and download the configuration file and make changes in a text editor. • Upload and download the configuration file through a telnet session or with Web Tools. Uploading and downloading a configuration file to multiple switches efficiently populates your SAN with consistent Fabric Watch settings.
Accessing Fabric Watch 2 Web Tools Web Tools provides a graphical user interface that can be launched from an internet browser as an alternative to Telnet and the command line interface. You can use Web Tools to any of the following operations. • • • • • • Activate Fabric Watch. View fabric and switch events. View and modify threshold and alarm configurations with the Fabric Watch View. Upload and download the configuration file. View and configure the FRU module.
2 28 Accessing Fabric Watch Fabric Watch Administrator’s Guide 53-1000601-01
Chapter 3 Configuring Fabric Watch In this chapter • Configuring Fabric Watch thresholds . . . . . . . . . . . . . . . . . . . . . . . . . . . . . . . • Configuring notifications . . . . . . . . . . . . . . . . . . . . . . . . . . . . . . . . . . . . . . . . . • Configuring switch status policy . . . . . . . . . . . . . . . . . . . . . . . . . . . . . . . . . . . • Configuring FRUs . . . . . . . . . . . . . . . . . . . . . . . . . . . . . . . . . . . . . . . . . . . . . . .
3 Configuring Fabric Watch thresholds Step 1: Select the class and area to configure During your planning activities, you should determine exactly what elements or monitors you want to configure, and in which class they reside. After you have made this decision, you need to identify the classes. To navigate to a specific class and area, use the fwConfigure command from a telnet prompt: 1. Log in to the switch as the administrator. 2. Type fwConfigure at the command prompt. 3.
Configuring Fabric Watch thresholds 3 For each class that you select, Fabric Watch provides a list of the areas of the class available for configuration. The final item in the list, which is always the default, returns you to the previous selection screen. 5. Type the number corresponding to the area that you want to configure, such as 7 for RXPerformance. Fabric Watch displays a list of monitored elements in this area. Figure 10 shows the monitored elements in the RXPerformance area menu.
3 Configuring Fabric Watch thresholds Step 2: Configure thresholds After you have identified and selected the appropriate class and areas, you can configure thresholds for those classes and areas. If you want a basic configuration, accept the default configuration settings. If you want to customize settings, proceed to option 4, advanced configuration.
Configuring Fabric Watch thresholds 3 Select threshold index => : (216..
3 Configuring Fabric Watch thresholds Select threshold index => : (216..
Configuring Fabric Watch thresholds 3 Threshold boundary level is setat : Default DefaultCustom Unit Percentage(%) Time base minuteminute Low 0 0 High 100 100 BufSize 0 0 Percentage(%) Threshold alarmlevel is set at: Default Errlog-1, SnmpTrap-2, PortLogLock-4 RapiTrap-8, EmailAlert-16 Valid alarm matrix is 31 DefaultCustom Changed 0 Below 0 Above 0 InBetween 0 0 0 0 0 1 : change behavior type 11 : 2 : change behavior interval 12 : 3 : change threshold boundary level 13 4 : change custom unit 14 : 5 :
3 Configuring Fabric Watch thresholds Fabric Watch displays the units of measurement (Unit), time base (Time base), low threshold (Low), high threshold (High) and buffer size (BufSize) for each column (see Figure 14). In Figure 14 a value of 80% is chosen as the custom high value for RXPerformance. The default value is 100%.
Configuring Fabric Watch thresholds Index 216 217 218 219 220 221 222 223 ThresholdName eportRXPerf216 eportRXPerf217 eportRXPerf218 eportRXPerf219 eportRXPerf220 eportRXPerf221 eportRXPerf222 eportRXPerf223 BehaviorType Triggered 1 Triggered 1 Triggered 1 Triggered 1 Triggered 1 Triggered 1 Triggered 1 Triggered 1 3 BehaviorInt Threshold boundary level is set at : Custom.
3 Configuring Fabric Watch thresholds Step 3: Configure alarms Alarms act as a signal or alert that notifies you when a threshold has been crossed. You can configure the following types of notification settings for Fabric Watch: • Triggered A triggered behavior type signals you once, after a threshold has been crossed. Triggered is the default behavior type signal for all class areas. • Continuous A continuous behavior type signals you continuously after a threshold has been crossed.
Configuring Fabric Watch thresholds 3 Threshold boundary level is setat : Custom DefaultCustom Unit Percentage(%) Time base minuteminute Low 0 0 High 100 80 BufSize 0 0 Percentage(%) Threshold alarmlevel is set at: Default Errlog-1, SnmpTrap-2, PortLogLock-4 RapiTrap-8, EmailAlert-16 Valid alarm matrix is 31 DefaultCustom Changed 0 Below 0 Above 0 InBetween 0 FIGURE 17 0 0 19 0 Change above alarm Figure 18 shows how to select the custom settings for the threshold alarm level for the RXPerformance ar
3 Configuring Fabric Watch thresholds Threshold boundary level is setat : Custom DefaultCustom Unit Percentage(%) Time base minuteminute Low 0 0 High 100 80 BufSize 0 0 Percentage(%) Threshold alarmlevel is set at: Custom . . . FIGURE 18 Changing the threshold alarm level Figure 19 shows how to apply the custom value for the threshold alarm changes; unless you apply the value, it does not take effect.
Configuring Fabric Watch thresholds 3 Table 14 describes the 18 customization options displayed at the end of the Advanced Configuration menu. With the exception of the last option, which exits advanced configuration mode, each option has similar behavior. For each option, one or two lines will appear, prompting you to accept the new setting information, and, after the information has been provided, the entire screen will refresh to display the updated information.
3 Configuring Fabric Watch thresholds TABLE 14 Advanced Configuration options (Continued) Option Effect Input information change below alarm Changes the notification method for below event occurrences for this method, but only affects the custom column. The required notification methods change inBetween alarm Changes the notification method for inBetween event occurrences for this method, but only affects the custom column.
Configuring notifications 3 Configuring notifications You can be notified of an alarm condition through a notification.
3 Configuring notifications Configuring API notifications In the Brocade Fabric OS API, notifications are triggered programatically. The Brocade Fabric OS API is an application programming interface (API) that provides the method for any application to access critical information about a Brocade SAN. Using Fabric OS API, an application can query or control individual switches or the entire fabric. You can also configure API notifications using the Brocade Fabric OS API.
Configuring notifications 3 Config Show Menu ____________________________ 1 : Environment class 2 : SFP class 3 : Port class 4 : Fabric class 5 : E-Port class 6 : F/FL Port (Optical) class 7 : Alpa Performance Monitor class 8 : End-to-End Performance Monitor class 9 : Filter Performance Monitor class 10 : Security class 11 : Resource class 12 : FRU class 13 : Quit Select an item => : (1..
3 Configuring notifications If the class does not have an e-mail configuration (there is no e-mail address assigned to the class), the following error message displays: Mail configuration for class Environment is not done. Email Alert is not enabled! The system returns to the main fwMailCfg menu. NOTE To ensure that the mail server address and domain name are configured correctly, use the dnsConfig command. For more details, see the Fabric OS Command Reference. Send test mail 1.
Configuring notifications 3 Relay host IP configuration 1. Type 6 in the fwMailCfg menu to configure a relay host IP address. The relay host configuration menu is displayed. 1 2 3 4 Display Relay Host configuration Set Relay Host IP Remove Relay Host configuration Quit 2. Select 2 to set the relay host IP address. The following message displays: enter the Relay Host IP: 3. Enter the relay host IP address (example: 192.168.39.118). The following message displays: Setting 192.168.39.118 as Relay Host..
3 Configuring switch status policy Configuring switch status policy The tasks for configuring a switch status policy are: “Step 1: Plan and define your switch status policy” on page 49 “Step 2: Implement your switch status policy” on page 49 “Step 3: View your switch status policy” on page 50 Your switch status policy monitors the overall status of a switch based on several contributing parameters.
Configuring switch status policy 3 Step 1: Plan and define your switch status policy Before entering the switchStatusPolicySet command, plan your switch status policy. How many fans must fail before you consider a switch Marginal? Look at the needs of your system along with the factors that affect its monitors. Table 15 lists the monitors in a switch and identifies the factors that affect their health. Note that not all switches use the monitors listed in Table 15.
3 Configuring FRUs Step 3: View your switch status policy After defining and configuring your switch status policy, you can view them using the switchStatusPolicyShow command. Note that the policy you defined here determines the output in the Switch Status Policy Report. See Chapter 4, “Generating Fabric Watch Reports” for more details about the Switch Status Policy Report. Configuring FRUs The configuration of FRUs is an exception to the procedures described thus far in this chapter.
Configuring Fabric Watch using Web Tools Fan WWN WWN Fru 3 Alarm Action: (0..17) [0] Alarm State: (0..31) [0] Alarm Action: (0..17) [0] configuration left unchanged FIGURE 22 fwFruCfg Configuration You can specify triggers for any number of alarm states or alarm actions. The first prompt enables you to select which FRU states trigger events. To select a group of FRU states: 1. Add the numbers beside each state (for the states you want to include). 2. Enter the total at the prompt.
3 Configuring Fabric Watch using SNMP FIGURE 23 Configuring Fabric Watch using SNMP In Figure 23, the MIB browser has populated the left side of the screen with a MIB tree that can be navigated. 3. Start a telnet session with the switch, and enter the snmpMibCapSet command at the prompt; this enables you to send Fabric Watch traps to an SNMP management station (see Figure 24). Then enter the agtCfgSet command to configure the SNMP management host IP address (see Figure 25).
Configuring Fabric Watch using SNMP 3 swd77:admin> agtcfgset Customizing MIB-II system variables ... At each prompt, do one of the following: o to accept current value, o enter the appropriate new value, o to skip the rest of configuration, or o to cancel any change. To correct any input mistake: erases the previous character, erases the whole line, sysDescr: [Fibre Channel Switch.] sysLocation: [End User Premise.] sysContact: [Field Support.
3 Configuring Fabric Watch using SNMP 4. Enter the IP address for the switch in the Host field in the MIB browser. Enter the community string in the Community field. To perform set operations, enter the write community into the Write Community field. 5. Click View from the MIB browser menu, then select Trap Viewer. The Trap Viewer is launched. Click Start in the Trap Viewer to start listening for traps (see Figure 26).
Configuring Fabric Watch using SNMP FIGURE 27 3 Trap Detail view 6. Expand the tree on the left to find the Fabric Watch OID information. To find the OID, use the following hierarchy: SW-MIB, bcsi, commDev, fibrechannel, fcSwitch, sw, swFwSystem. Fabric Watch displays a screen similar to the one shown in Figure 28.
3 Configuring Fabric Watch using SNMP 7. Obtain the specific identifier for the element that will be modified. To get the identifier, click the swFwThresholdTable and swFwThresholdEntry directory, and run a get operation on swFwName. A list of elements appears in which each element is preceded by an identifier. Remember the numeric portion of the identifier, which appears before the “==>” symbol. You can scroll through the list to find the numeric identifier for the element in which you are interested.
Chapter Generating Fabric Watch Reports 4 In this chapter • Types of Fabric Watch reports . . . . . . . . . . . . . . . . . . . . . . . . . . . . . . . . . . . . 57 • Viewing Fabric Watch reports . . . . . . . . . . . . . . . . . . . . . . . . . . . . . . . . . . . . . 62 Types of Fabric Watch reports You can run reporting commands in Fabric Watch to get instant access to switch information.
4 Types of Fabric Watch reports Example: SAM Report Total Total Down Total Up Time Down Time Occurrence Offline Time (Percent) (Percent) (Times) (Percent) ============================================================================= 1/0 U 0 0 0 100 1/1 U 0 0 0 100 1/2 U 0 0 0 100 1/3 U 0 0 0 100 1/4 U 0 0 0 100 1/5 U 0 0 0 100 1/6 U 0 0 0 100 1/7 U 0 0 0 100 1/8 U 0 0 0 100 1/9 U 0 0 0 100 1/10 U 0 0 0 100 1/11 U 0 0 0 100 1/12 EX 100 0 0 0 1/13 EX 100 0 0 0 1/14 EX 100 0 0 0 1/15 EX 100 0 0 0 2/0 U 0 0 0
Types of Fabric Watch reports 4 Table 16 describes the fields in the SAM report. TABLE 16 SAM report information Heading Meaning Total Up Time (Percent) The percentage of time that the port is active Total Down Time (Percent) The percentage of time that the port experiences faults Down Occurrence (Count) The number of faults experienced on the port Total Offline Time (Percent) The percentage of time that the port is inactive for reasons other than a fault.
4 Types of Fabric Watch reports Switch status policy report The switch status policy report lets you see the current policy parameters. Run the switchStatusPolicyShow command to generate a switch status policy report. The following example of the switchStatusPolicyShow command output is for modular switches such as the Brocade 24000. For modular switches, the switch status policy report also contains information on the WWN, Blade, and CP.
Types of Fabric Watch reports 4 Example: Port detail report Port Detail Report Report time: 04/24/2007 03:40:10 AM Switch Name:geo_hi IP address:1080::8:800:200C:417A Port Exception report [by All] --------Port-Errors------------ -----SFP-Errors---Port# Type State Dur(H:M) LFA LSY LSI PER INW CRC PSC BLP STM SRX STX SCU SVO ------------------------------------------------------------------------------080 U OFFLINE 062:17 - - - - - - 081 U OFFLINE 062:17 - - - - - - 082 U OFFLINE 062:17 - - - - - - 083 U O
4 Viewing Fabric Watch reports Table 17 lists and describes each item in the port detail report.
Viewing Fabric Watch reports 4 Viewing Fabric Watch reports using Web Tools To view Fabric Watch reports using Web Tools, connect to a switch using a web browser, and select the report button (shown in Figure 30). FIGURE 30 Report button A report view window (shown in Figure 31) displays. FIGURE 31 Report View window The Web Tools report view window contains choices to view the switch health, port detail, or SAM report. NOTE The switch status policy report is not available through Web Tools.
4 Viewing Fabric Watch reports Customizing reports To customize reports, click the Action button above the report tree in the window. The menu, shown in Figure 32, displays. FIGURE 32 Action menu The following section explains the options in the Action menu. Refresh report Use this option to update the current report with the new data. Customize report Use this option to modify the report design. When you select the customize report option, the report customization window (shown in Figure 33) displays.
Viewing Fabric Watch reports 4 The report customization window contains the following: • Name—Enter the report name in this field. The name you enter appears at the top of the report. • Options—Select the type of report to generate by clicking one of the following options: • Switch Health • SAM • Port Detail If you select the Port Detail option, you can filter the ports for which the report is generated based on port number or port state.
4 66 Viewing Fabric Watch reports Fabric Watch Administrator’s Guide 53-1000601-01
Appendix A Default Threshold Values In this appendix • Overview . . . . . . . . . . . . . . . . . . . . . . . . . . . . . . . . . . . . . . . . . . . . . . . . . . . . . . • Environment class . . . . . . . . . . . . . . . . . . . . . . . . . . . . . . . . . . . . . . . . . . . . . . • Fabric class . . . . . . . . . . . . . . . . . . . . . . . . . . . . . . . . . . . . . . . . . . . . . . . . . . . • Performance Monitor class. . . . . . . . . . . . . . . . . . . . . . . . . . . . . . . . . . . . . . .
Environment class Environment class Table 19 provides default Environment class settings for all switches. Check the appropriate hardware reference manual for differences in actual environmental requirements. NOTE For the Brocade 200E, there is no fan default threshold because the fans are not monitored by Fabric Watch. You can use the fanShow command to view the Brocade 200E fan status.
Environment class TABLE 19 Environment class threshold defaults (Continued) Area Description Default threshold settings Default alarm settings Threshold state Power Supply Monitors power supply condition Time Base: none Changed: 0 Below: 3 Above: 3 In-Between: 0 Informative Out_of_range In_range Informative Changed: 0 Below: 3 Above: 3 In-Between: 3 Informative Out_of_range Out_of_range In_range OK: 1 ( Faulty: 0 Temperature Monitors switch temperature in Celsius Unit: degrees C Time Base:
Fabric class Fabric class Table 20 provides default settings for areas in the Fabric class. These defaults are hardware-dependent. Check the appropriate Hardware Reference Manual for differences in environmental requirements.
Performance Monitor class Performance Monitor class Table 21 provides default settings for areas in the AL_PA Performance Monitor class.
Port class Port class Table 24 provides default settings for areas in the Port class.
Port class Table 25 provides default settings for areas in the E-Port class.
Port class TABLE 25 E-Port class threshold defaults (Continued) Area Description Default threshold settings Default alarm settings Threshold state Utilization (VE-port) Monitors utilization of VE-ports by percentage Unit: Percentage(%) Time Base: minute Low: 0 High: 100 Buffer: 0 Changed: 0 Below: 0 Above: 0 In-Between: 0 Informative Informative Informative Informative Packet Loss (VE-port) Monitors total packet loss by percentage Unit: Percentage(%) Time Base: minute Low: 0 High: 100 Buffer:
Resource class TABLE 26 F/FL_Port class threshold defaults (Continued) Area Description Default threshold settings Default alarm settings Threshold state Loss of Signal Count Monitors the number of signal loss errors Unit: Error(s) Time Base: minute Low: 0 High: 5 Buffer: 0 Changed: 0 Below: 0 Above: 0 In-Between: 0 Informative Informative Out_of_range In_range Primitive Sequence Protocol Error Monitors the number of primitive sequence errors Unit: Error(s) Time Base: minute Low: 0 High: 5 Bu
Security class TABLE 28 76 Security class threshold defaults (Continued) Area Description Default threshold settings Default alarm settings Threshold state HTTP Violations Monitors HTTP violations Unit: Violation(s) Time Base: minute Low: 1 High: 2 Buffer: 0 Changed: 0 Below: 0 Above: 3 In-Between: 0 Informative Informative Out_of_range In_range Illegal Commands Monitors illegal commands Unit: Violation(s) Time Base: minute Low: 1 High: 2 Buffer: 0 Changed: 0 Below: 0 Above: 3 In-Between: 0
Security class TABLE 28 Security class threshold defaults (Continued) Area Description Default threshold settings Default alarm settings Threshold state SCC Violations Monitors SCC violations Unit: Violation(s) Time Base: minute Low: 1 High: 2 Buffer: 0 Changed: 0 Below: 0 Above: 3 In-Between: 0 Informative Informative Out_of_range In_range Serial Violations Monitors serial violations Unit: Violation(s) Time Base: minute Low: 1 High: 2 Buffer: 0 Changed: 0 Below: 0 Above: 3 In-Between: 0 In
SFP class SFP class Table 29 provides default settings for areas in the SFP class. NOTE SFPs connected to GbE ports are not monitored.
Appendix Basic Fabric Watch Configuration Guidelines B A default Fabric Watch configuration is available for the purpose of saving setup time. As you gain familiarity with Advanced Fabric Watch features, they can be tailored to suit the fabric environment. The custom settings available in Fabric Watch provide an advanced user much needed flexibility of redefining boundary thresholds and alarm notification methods.
Basic Fabric Watch Configuration Guidelines 80 Fabric Watch Administrator’s Guide 53-1000601-01
Appendix Using Product Name with Configuration Files C In this appendix • Overview . . . . . . . . . . . . . . . . . . . . . . . . . . . . . . . . . . . . . . . . . . . . . . . . . . . . . . 81 • Configuration files . . . . . . . . . . . . . . . . . . . . . . . . . . . . . . . . . . . . . . . . . . . . . . 81 • Profiles . . . . . . . . . . . . . . . . . . . . . . . . . . . . . . . . . . . . . . . . . . . . . . . . . . . . . . .
Profiles Profiles Brocade provides partial configuration files, or profiles, that help you configure Product Name in a way that is most appropriate to your particular SAN needs. To configure Product Name with a profile 1. Upload the configuration file to the host by typing configUpload. 2. Open one of the profiles that appears on the Brocade Web site at http://www.brocade.com/support/mibs_rsh/index.jsp 3. Open your configuration file in a text editor. 4.
Index A above event triggers, 15 activating with advanced web tool, 27 with telnet, 23 activating Fabric Watch, 23–?? Admin View, 27 advanced configuration options, 41 alarms configuring, 38 continuous, 2, 11, 38 notifications, 43 triggered, 2, 11, 38 areas, 5 assigning notification methods, 20 B commands configdownload, 81 configupload, 81 fwclassinit, 24 fwconfigreload, 81 fwconfigure, 24 fwfrucfg, 24 fwmailcfg, 24 configdownload, 81 configupload, 81 configuration advanced, 35 configuration file capabi
R fwclassinit, 24 fwconfigreload, 81 fwfrusfg, 24 fwmailcfg, 24 RapiTrap, 19 resource class area, 8 H S high and low thresholds, 12 security class areas, 8 setting time base to none, 13 SFP class areas, 9 SNMP, 2 capabilities, 25 SNMP trap, 19 specifying a time base, 13 switch event (error) log entry, 18 switch policies, 21 switch status down, 48 healthy, 48 marginal, 48 switch status policy, 48 system requirements, 23 I in-between triggers, 17 installing Fabric Watch, 1 interface types, 24 interpret
V values, default, 67 Fabric Watch Administrator’s Guide 53-1000601-01 85
86 Fabric Watch Administrator’s Guide 53-1000601-01