HP StorageWorks Fabric OS 5.0.
Legal and notice information © Copyright 2005 Hewlett-Packard Development Company, L.P. © Copyright 2005 Brocade Communications Systems, Incorporated. Hewlett-Packard Company makes no warranty of any kind with regard to this material, including, but not limited to, the implied warranties of merchantability and fitness for a particular purpose.
Contents About this guide . . . . . . . . . . . . . . . . . . . . . . . . . . . . . . . . . . . . . . . . . . . . . 9 Intended audience . . . . . . . . . . . . . . . . . . . . . . . . . . . . . . . . Related documentation . . . . . . . . . . . . . . . . . . . . . . . . . . . . . Document conventions and symbols . . . . . . . . . . . . . . . . . . . . HP technical support . . . . . . . . . . . . . . . . . . . . . . . . . . . . . . . HP Storage web site. . . . . . . . . . . . . . . . . . . . . . . . . . . . .
Changing the switch name . . . . . . . . . . . . . . . . . . . . . . . . . . . . . . . . . . . . . . . . . . . . . . . . . . . . . . Changing the switch domain ID. . . . . . . . . . . . . . . . . . . . . . . . . . . . . . . . . . . . . . . . . . . . . . . . . . . Viewing and printing a switch report . . . . . . . . . . . . . . . . . . . . . . . . . . . . . . . . . . . . . . . . . . . . . . . Rebooting the switch . . . . . . . . . . . . . . . . . . . . . . . . . . . . . . . . . . . . . . . . . . . . . . . .
Displaying the name server entries . . . . . . . . . . . . . . . . . . . . . . . . . . . . . . . . . . . . . . . . . . . . . . . . . . Displaying switch information. . . . . . . . . . . . . . . . . . . . . . . . . . . . . . . . . . . . . . . . . . . . . . . . . . . . . . Displaying detailed fan hardware status . . . . . . . . . . . . . . . . . . . . . . . . . . . . . . . . . . . . . . . . . . . . Displaying the temperature status. . . . . . . . . . . . . . . . . . . . . . . . . . . . . . . . . . . . . . . .
Removing offline devices from the zoning database . . . . . . . . . . . . . . . . . . . . . . . . . . . . . . . . . 114 Replacing offline devices . . . . . . . . . . . . . . . . . . . . . . . . . . . . . . . . . . . . . . . . . . . . . . . . . . . . 114 Defining device aliases . . . . . . . . . . . . . . . . . . . . . . . . . . . . . . . . . . . . . . . . . . . . . . . . . . . . . 114 6 Performance monitoring administration . . . . . . . . . . . . . . . . . . . . . . . . .
9 10 11 12 13 14 15 16 17 18 19 20 21 22 23 24 25 26 27 28 29 30 31 32 33 34 35 36 37 38 39 40 41 42 43 44 45 46 47 48 Configure tab, Fabric subtab. . . . . . . . . . . . . . . . . . . . . . . . . . . . . . . . . . . . . . . . . . . . . . . . . . . . 50 Ports tab . . . . . . . . . . . . . . . . . . . . . . . . . . . . . . . . . . . . . . . . . . . . . . . . . . . . . . . . . . . . . . . . . . 52 Extended Fabric tab . . . . . . . . . . . . . . . . . . . . . . . . . . . . . . . . . . . . . . . . . . . . . .
Contents
About this guide This document provides information to assist fabric administrators in using the web-based graphical user interface (GUI) to monitor and modify their HP StorageWorks switch fabrics.
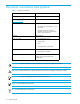
Document conventions and symbols Document conventions Table 1 Convention Element Medium blue text: Figure 1 Cross-reference links and e-mail addresses Medium blue, underlined text (http://www.hp.
HP technical support Telephone numbers for worldwide technical support are listed on the following HP web site: http://www.hp.com/support/. From this web site, select the country of origin. NOTE: For continuous quality improvement, calls may be recorded or monitored.
About this guide
1 Introducing Advanced Web Tools HP StorageWorks Advanced Web Tools is a GUI that enables administrators to monitor and manage single or small fabrics, switches, and ports from a standard workstation. It is included with every HP StorageWorks B-Series switch. Web Tools provides the administrative control point for HP Advanced Fabric Services, including Advanced Zoning, ISL Trunking, Advanced Performance Monitoring, and Fabric Watch.
The login dialog box is displayed. 4) Type the user name of an account and the admin, switchAdmin, or user role. 5) Type the password. 6) Click OK. • On page 1-3: After this sentence: The SAN Switch 2/8V Switch Explorer view (shown in Figure 4 on page 29) is a good example showing how the SAN Switch 2/16V, SAN Switch 2/32, and SAN Switch 4/32 Switch Explorer views look.
With the following: For all other switch types (HP StorageWorks SAN Switch 2/8V, SAN Switch 2/16V, SAN Switch 2/32, SAN Switch 4/32, and Brocade 4Gb SAN Switch for HP p-Class BladeSystem), the Switch Information View is located below the graphic representation of the switch. • On page 32, after the section “Displaying switches in the fabric,” add the following section: Ending the Web Tools session You can end your Web Tools session by either logging out or closing the Switch Explorer browser window.
With the following: You can use Web Tools 5.0.0 with the following hardware: • On page 39, in the section “Switch support,” add the following to the list of switches: • Brocade 4Gb SAN Switch for HP p-Class BladeSystem • On page 42, in the section “Managing fabrics, switches, and ports using Advanced Web Tools,” replace the first two sentences: When you click the Admin button from the Switch View, you must log in as an admin to launch the Switch Admin module.
• On page 52, replace Figure 10, “Ports tab,” with the following: Figure 10 Ports tab • On page 17, add the following section after Figure 10: Configuring port type The Current Type column in the Ports tab indicates the current type of the port. Use the following procedure to change the port type. To change the port type 1. Launch the Switch Admin module as described on page 43. 2.
5. Check the Enable E-Port checkbox to allow the port to be an E_Port; however, do not check this option if the topology is Loop[L-Port]. (A port cannot be both an E_Port and an L_Port.) 6. Click Apply. • On page 52, in the section “Configuring port speed,” replace this sentence: For HP StorageWorks SAN Switch 2/8V, SAN Switch 2/16V, SAN Switch 2/32, and SAN Switch 4/32 switches, proceed directly to the next step.
• On page 56, replace Figure 11, “Extended Fabric tab,” with the following: Figure 11 Extended Fabric tab • On page 56, in the section, “To configure a port for long-distance connection,” replace this sentence: For HP StorageWorks SAN Switch 2/8V, SAN Switch 2/16V, SAN Switch 2/32, and SAN Switch 4/32 switches, proceed directly to the next step.
• device-based (SAN Switch 4/32 and Brocade 4Gb SAN Switch for HP p-Class BladeSystem only) • exchanged-based (SAN Switch 4/32 and Brocade 4Gb SAN Switch for HP p-Class BladeSystem only) For the SAN Switch 4/32 and Brocade 4Gb SAN Switch for HP p-Class BladeSystem, the exchange-based routing policy is the default.
The User tab of the Switch Admin module (see Figure 17) displays account information and enables you to create and manage user accounts. With the following: If you are logged in as an admin, the User tab of the Switch Admin module (see Figure 17) displays account information and enables you to create and manage user accounts. If you are logged in as a switchAdmin, you can change your own password but cannot view or modify other accounts.
3) Enter the user name of an account with the admin role. 4) Enter the password. • On page 90, in the “Displaying port information” section, in the last paragraph, replace this sentence: For the HP StorageWorks SAN Switch 2/8V, SAN Switch 2/16V, SAN Switch 2/32, and SAN Switch 4/32, there are no subtabs for the slots, there are no subtabs for the slots.
Director 2/128, SAN Switch 2/8V, SAN Switch 2/16V, SAN Switch 2/32, and SAN Switch 4/32 cannot be members of an FA zone. With the following: FA zones can be administered using Fabric OS 5.x; however, switches or directors running Fabric OS v5.x cannot be members of a Fabric Assist zone. HP StorageWorks Core Switch 2/64, SAN Director 2/128, SAN Switch 2/8V, SAN Switch 2/16V, SAN Switch 2/32, SAN Switch 4/32, and Brocade 4Gb SAN Switch for HP p-Class BladeSystem cannot be members of a FA zone.
4) Enter the password. • On page 129, in Table 11, “Firmware Download” row, replace this sentence: SAN Switch 2/8V, SAN Switch 2/16V, SAN Switch 2/32, and SAN Switch 4/32 switches: loss of network connectivity is up to 1 minute if POST is disabled. With the following: SAN Switch 2/8V, SAN Switch 2/16V, SAN Switch 2/32, SAN Switch 4/32, and Brocade 4Gb SAN Switch for HP p-Class BladeSystem: loss of network connectivity is up to 1 minute if POST is disabled.
Figure 1 Advanced Web Tools Switch Explorer for a SAN Switch 4/32 Switch Explorer The first thing you see when you log in to a switch with Advanced Web Tools is the Switch Explorer (Figure 1). The Switch Explorer is divided into areas that provide access to and information about the switch and fabric.
The format of the Switch Explorer varies depending on the hardware type. Figure 2 on page 27 through Figure 4 on page 29 show Switch Explorer examples for several HP StorageWorks switches. The SAN Switch 2/8V Switch Explorer view (shown in Figure 4 on page 29) is a good example showing how the SAN Switch 2/16V, SAN Switch 2/32, and SAN Switch 4/32 Switch Explorer views look. Note that these figures are grayed out so that you can more easily see the areas of the Switch Explorer.
Figure 2 shows an example of the Advanced Web Tools Switch Explorer for a Core Switch 2/64. A B E C D Active CP Arrow F Figure 2 Advanced Web Tools Switch Explorer for a Core Switch 2/64 In Figure 2, the Core Switch 2/64 has two domains; there is a separate set of Switch View buttons for each logical switch. When only one domain exists, there is one shared set of Switch View buttons, as displayed in Figure 3.
Figure 3 shows an example of the Advanced Web Tools Switch Explorer for a SAN Director 2/128 at the bottom of the CP display. A B Active CP LED Indicators C D Active CP Arrow E F Figure 3 Advanced Web Tools Switch Explorer for a SAN Director 2/128 The active CP in the SAN Director 2/128 is labeled with a small arrow at the bottom of the CP display. The SAN Director 2/128 active CP is also indicated with the blue Active CP LED indicator, as shown in Figure 3.
Figure 4 is an example of the Advanced Web Tools Switch Explorer for a SAN Switch 2/8V. This is the same format of the Switch Explorer used in Advanced Web Tools for the SAN Switch 2/16V, SAN Switch 2/32, and SAN Switch 4/32. A B D C E F Figure 4 Advanced Web Tools Switch Explorer for a SAN Switch 2/8V Different areas of the Switch Explorer refresh at different rates. Table 3 lists the polling rates for the various panels in Advanced Web Tools.
Use the menu at the top of the panel to view switches in the Fabric Tree by switch name, IP address, or WWN. The background color of the switch icon indicates the current status of the switch. The Fabric Tree is updated at time intervals, depending on the number of switches in the fabric. On average, for a fabric with up to 12 switches, the Fabric Tree is updated every 30 seconds. For every additional 12 switches in the fabric, an additional 30 seconds are required to update the Fabric Tree.
It is important to note that certain Fabric OS features are available only on particular switch types; therefore, the icons for those features are displayed only for those switch types. For example, the High Availability feature is available only on the Core Switch 2/64 and SAN Director 2/128. Thus, the HA Admin button is displayed in the Switch View button menu only for these switches.
Displaying Switches in the fabric If your fabric has more than one switch, you can launch Advanced Web Tools from one switch and then access other switches. To access the Switch Explorer for a particular switch: 1. Launch Advanced Web Tools (see ”Launching Advanced Web Tools” on page 24). The Switch Explorer is displayed for the switch you logged in to. The Fabric Tree is expanded by default when you first launch Advanced Web Tools. 2.
Primary-FCS-only functionality The following Advanced Web Tools functionality is reserved for the primary FCS when secure mode is enabled: • Zoning administration is allowed only from the primary FCS switch when secure mode is enabled. For all other switches in a secure fabric, the Zoning button is disabled. • SNMP community strings can be modified only from the primary FCS switch when secure mode is enabled.
Introducing Advanced Web Tools
2 Requirements, installation, and support Before you install Advanced Web Tools on your workstation, verify that your switches and workstation meet the Advanced Web Tools requirements specified in this chapter, which contains the following sections: • Requirements, page 35 • Installing an Advanced Web Tools license, page 37 • Value line licenses, page 39 • Switch support, page 39 Requirements Advanced Web Tools requires any browser that conforms to HTML version 4.0, JavaScript version 1.
Adequate RAM is required on Windows systems as follows: • 256 MB or more RAM for fabrics comprising 15 switches or fewer • 512 MB or more RAM for fabrics comprising more than 15 switches HP also recommends a minimum of 8 MB of video RAM. Configuring Internet Explorer Correct operation of Advanced Web Tools with Internet Explorer requires specifying the appropriate settings for browser refresh frequency and process model.
3. Create a symbolic link from this location: $MOZILLA/plugins/libjavaplugin_oji.so to this location: $JRE/plugin/$ARCH/ns600/libjavaplugin_oji.so To install patches on Solaris: 1. Search for any required patches for your current version of the JRE at the following Web site: http://java.sun.com/j2se/1.4.2/install_solaris.html NOTE: This URL is subject to change without notice. 2. Follow the link to download the patch; exit the browser when done. 3. Install the patch and reboot the system.
A list is displayed, showing all the licenses currently installed on the switch: switch:admin> licenseshow 1A1AaAaaaAAAA1a: ]-- This is the license key. The installed feature is listed below. Zoning license 1A2AaAbbbBBBA1a: SES license 1A3AaAbcbBBCC1d: QuickLoop license If the Advanced Web Tools license is not included in the list or is incorrect, continue with step 3. 3. On the command line, issue the following command: licenseadd key where key is the license key.
Value line licenses If your fabric includes a switch with a limited switch license and you are launching Advanced Web Tools using that switch and if the fabric exceeds the switch limit indicated in the license, Advanced Web Tools allows a 45-day grace period in which you can still monitor the switch through Advanced Web Tools. However, Advanced Web Tools then displays periodic warning messages.
Requirements, installation, and support
3 Managing your fabrics, switches, and ports This chapter contains the following sections: • Managing fabrics, switches, and ports using Advanced Web Tools, page 42 • Launching the Telnet window, page 43 • Configuring IP and netmask information, page 44 • Configuring a syslog IP address, page 45 • Performing a firmware download, page 45 • Configuring a switch, page 46 • Rebooting the switch, page 48 • Configuring fabric parameters, page 48 • Configuring FAN frame notification parameters, page 51 • Configuri
Managing fabrics, switches, and ports using Advanced Web Tools You can perform most of management tasks described in this chapter through the Switch Admin module. Information in the Switch Admin module is retrieved from the selected switch. Click the Admin button in the Switch View to access the Switch Admin module. Figure 6 shows the Switch Admin module. Figure 6 Switch Admin module When you click the Admin button from the Switch View, you must log in as an admin to launch the Switch Admin module.
The remainder of this section describes basic Switch Admin module procedures that are useful for many switch-management operations. Launching the Switch Admin module Most of the management procedures in this chapter are performed from the Switch Admin module. To access the Switch Admin module: 1. Select a switch from the Fabric Tree. The selected switch appears in the Switch View. 2. Click the Admin button from the Switch View. The login dialog box opens. 3.
Configuring IP and netmask information When you configure IP and netmask information for the Core Switch 2/64 or SAN Director 2/128, the configuration is on a logical-switch basis. This means that for each logical switch, you must also configure IP and subnet mask information individually. To configure IP and netmask information: 1. Launch the Switch Admin module as described on page 43. 2. Click the Network tab (see Figure 7). 3. Type a new value in the appropriate field (for example, 123.123.123.123). 4.
Configuring a syslog IP address The syslog IP address is the IP address of the server that is running the syslog process. The syslog daemon reads and forwards system messages to the appropriate log files and users, depending on the system configuration. When one or more IP addresses are configured, the switch forwards all error log entries to the syslog on the specified servers. Up to six servers are supported. Refer to the HP StorageWorks Fabric OS 4.
Figure 8 Firmware tab Configuring a switch Use the Switch tab of the Switch Admin module to perform basic switch configuration. Figure 6 on page 42 shows an example of the Switch tab. Enabling and disabling a switch You can determine whether a switch is enabled or disabled in the Switch Admin module by looking at the bottom right corner: the icon means that the switch is enabled, and the icon means that the switch is disabled. To enable or disable a switch: 1.
Changing the switch name Switches can be identified by IP address, domain ID, World Wide Name (WWN), or by customized switch names that are unique and meaningful. Switch names can be a maximum of 15 characters for Fabric OS v4.x. They must begin with an alphabetic character, but otherwise can consist of any combination of alphanumeric and underscore characters. To change the switch name: 1. Launch the Switch Admin module as described on page 43. 2. Click the Switch tab. 3.
To view or print a switch report: 1. Launch the Switch Admin module as described on page 43. 2. Click the Switch tab. 3. Click View Report. A switch report opens in a new window. 4. View or print the report using your browser. Rebooting the switch When you reboot the switch, the reboot takes effect immediately. Performing a fast boot A fast boot reduces boot time significantly by bypassing power-on self test (POST). To perform a switch fast boot: 1. Launch the Switch Admin module as described on page 43.
• E_D_TOV: Error detect time-out value (in milliseconds). This timer is used to flag a potential error condition when an expected response is not received within the set time. The valid range is 1000 through 5000. • Datafield size: The largest possible data field size (in bytes). The valid range is 256 through 2112.
Figure 9 Configure tab, Fabric subtab To configure fabric parameters: 1. Launch the Switch Admin module as described on page 43. 2. Disable the switch (see ”Enabling and disabling a switch” on page 46). 3. Click the Configure tab. 4. Click the Fabric subtab. 5. Make the fabric parameter configuration changes. 6. Click Apply. 7. Enable the switch (see ”Enabling and disabling a switch” on page 46).
To enable insistent domain ID mode: 1. Launch the Switch Admin module as described on page 43. 2. Disable the switch (see ”Enabling and disabling a switch” on page 46). 3. Click the Configure tab. 4. Click the Fabric subtab. 5. Select the Insistent Domain ID Mode check box. 6. Click Apply. 7. Enable the switch (see ”Enabling and disabling a switch” on page 46).
Configuring ports Use the Ports tab of the Switch Admin module to perform the basic port configuration procedures described in this section. Figure 10 shows an example of the Ports tab. Figure 10 Ports tab Configuring port speed The Current Speed column in the Ports tab indicates the current speed of the port. Use the following procedure to change or configure the port speed: 1. Launch the Switch Admin module as described on page 43. 2. Click the Ports tab. 3.
Assigning a name to a port Port names are optional. You can assign a name to a port to make port grouping easier. The Port Name column in the Ports tab displays the port name, if one exists. To name a port: 1. Launch the Switch Admin module as described on page 43. 2. Click the Ports tab. 3. Perform of the following, depending on the type of switch: • For Core Switch 2/64 and SAN Director 2/128, select the slot subtab that corresponds to the correct slot for the logical switch.
To enable or disable a port: 1. Launch the Switch Admin module as described on page 43. 2. Click the Ports tab. 3. Perform of the following, depending on the type of switch: • For Core Switch 2/64 and SAN Director 2/128, select the slot subtab that corresponds to the correct slot for the logical switch. • For HP StorageWorks SAN Switch 2/8V, SAN Switch 2/16V, SAN Switch 2/32, and SAN Switch 4/32, proceed directly to the next step. 4.
Configuring a port for long distance The Extended Fabric tab of the Switch Admin module displays information about the port speed, long distance setting, and buffer credits, as shown in Figure 11 on page 56. Use this tab to configure the long-distance setting of a port. For detailed information on managing extended fabrics, refer to the HP StorageWorks Fabric OS 4.x procedures user guide.
Figure 11 Extended Fabric tab To configure a port for long-distance connection: 1. Launch the Switch Admin module as described on page 43. 2. Click the Extended Fabric tab. 3. Perform of the following, depending on the type of switch: • For Core Switch 2/64 and SAN Director 2/128, select the slot subtab that corresponds to the correct slot for the logical switch. • For HP StorageWorks SAN Switch 2/8V, SAN Switch 2/16V, SAN Switch 2/32, and SAN Switch 4/32, proceed directly to the next step. 4.
This value is the upper limit for calculating buffer availability for other ports in the same port group. If the actual distance is more than the desired distance, the port operates in buffer-limited mode. c. Press Enter or click another port entry for the value to be accepted. 6.
Figure 12 Routing tab for port-based routing policy Displaying fabric shortest path first (FSPF) routing The Routing tab of the Switch Admin module displays information about routing paths. To view FSPF routing: 1. Launch the Switch Admin module as described on page 43. 2. Click the Routing tab. 3. Perform of the following, depending on the type of switch: • For Core Switch 2/64 and SAN Director 2/128, click a slot number under the FSPF Route category in the navigation tree.
To configure a static route: 1. Launch the Switch Admin module as described on page 43. 2. Click the Routing tab. 3. Perform of the following, depending on the type of switch: • For Core Switch 2/64 and SAN Director 2/128, select a slot number under the Static Route category in the navigation tree and then click Add. • For HP StorageWorks SAN Switch 2/8V, SAN Switch 2/16V, SAN Switch 2/32, and SAN Switch 4/32, select the Static Route category in the navigation tree and then click Add.
Specifying frame order delivery In a stable fabric, frames are always delivered in order, even when the traffic between switches is shared among multiple paths. However, when topology changes occur in the fabric (for example, if a link goes down), traffic is rerouted around the failure, and some frames could be delivered out of order. By default, frame delivery is out-of-order across topology changes.
Maintaining configurations It is important to maintain consistent configuration settings on all switches in the same fabric, because inconsistent parameters (such as inconsistent PID formats) can cause fabric segmentation. As part of standard configuration maintenance procedures, HP recommends that you back up configuration data for every switch on a host computer server for emergency reference. The following sections contain procedures for basic switch configuration maintenance.
5. Enter the user name, password, and host IP information. 6. Enter the configuration file with a fully-qualified path. 7. Click Apply. You can monitor the progress by looking at the Upload/Download Progress bar on the Configure tab. Restoring a configuration Restoring a configuration involves overwriting the configuration on the switch by downloading a previously saved backup configuration file. Perform this procedure during a planned down time.
Figure 14 License tab Activating a license on a switch Before you can unlock a licensed feature, you must obtain a license key. You can either use the license key provided in the Paper Pack supplied with switch software or refer to the HP StorageWorks Fabric OS 4.x procedures user guide for instructions on how to obtain a license key. To activate a license on a switch: 1. Launch the Switch Admin module as described on page 43. 2. Click the License tab. 3. Click Add. The Add License dialog box opens. 4.
Removing a License from a Switch CAUTION: Removing the Advanced Web Tools license from a switch makes that switch unavailable from Advanced Web Tools. If you remove the Advanced Web Tools license from a Core Switch 2/64 or SAN Director 2/128, both logical switches are unavailable from Advanced Web Tools. To remove a license from a switch: 1. Launch the Switch Admin module as described on page 43. 2. Click the License tab. 3. Select the license you want to remove. 4. Click Remove.
Figure 15 Trunking tab Displaying trunk group information Use this procedure to display the following information about ISL Trunking groups: • Trunk group number identifier • Master port • Member ports To view information on a trunk group: 1. Launch the Switch Admin module as described on page 43. 2. Click the Trunking tab. 3. Optional: Click Refresh to refresh the information.
3. Perform of the following, depending on the type of switch: • For Core Switch 2/64 and SAN Director 2/128, select the slot subtab that corresponds to the correct slot for the logical switch. • For HP StorageWorks SAN Switch 2/8V, SAN Switch 2/16V, SAN Switch 2/32, and SAN Switch 4/32, proceed directly to the next step. 4. To enable trunking mode on a port, select the check box in the Enable Trunking column that corresponds to the port you want to trunk.
Figure 16 Trace tab How a trace dump is used The generation of a trace dump causes a Critical message to be logged to the system error log. When a trace dump is detected, issue the supportSave command on the affected switch. This command packages all error logs, the supportShow output, and the trace dump, and moves these to your FTP server. You can also configure your switch to automatically copy trace dumps to your FTP server (see ”Setting up automatic trace dump transfers”).
You should also set up a periodic checking of the remote server so that you are alerted if the server becomes unavailable and you can correct the problem. Refer to the HP StorageWorks Fabric OS 4.x procedures user guide for additional information. The following procedures describe in detail the tasks for setting up automatic transfer. To specify a remote server: 1. Launch the Switch Admin module as described on page 43. 2. Click the Trace tab. 3.
6. Click OK. Creating and maintaining user-defined accounts In addition to the four default accounts—root, factory, admin, and user—Fabric OS supports up to 15 user-defined accounts in each logical switch (domain). These accounts expand your ability to track account access and audit administrative activities. The User tab of the Switch Admin module (see Figure 17) displays account information and enables you to create and manage user accounts.
The Add User Account dialog box opens. 4. Enter the user name, which must begin with an alphabetic character. The name can be up to 40 characters long. It is case sensitive and can contain alphabetic and numeric characters, the dot (.) and the underscore ( _ ). It must be different from all other account names on the logical switch. 5. Select a role from the list: either admin or user in nonsecure mode; admin, user, or nonfcsadmin in secure mode. 6. Optional: Enter a description of the account. 7.
6. Type a new description. You can change the description only on user-level accounts. You cannot change the description of the default accounts. You cannot change the description of your own account. 7. Select the Enabled or Disabled radio button to enable or disable the account. You can enable and disable user- and admin-level accounts except for your own account. You cannot enable or disable your own account or the factory account. Only the root account can disable itself.
To set trap levels: 1. Launch the Switch Admin module as described on page 43. 2. Click the SNMP tab (see Figure 18). Figure 18 SNMP tab 3. Select a trap level for a recipient from the corresponding Trap Level list in the SNMPv1 and SNMPv3 sections. The level you select identifies the minimum event level that will prompt a trap. 4. Click Apply.
To set SNMPv1 configuration parameters: 1. Launch the Switch Admin module as described on page 43. 2. Click the SNMP tab (see Figure 18 on page 72). 3. Double-click a community string in the SNMPv1 section and enter a new community string. 4. Double-click a recipient IP address in the SNMPv1 section and enter a new IP address. 5. Click Apply. To set SNMPv3 configuration parameters: 1. Launch the Switch Admin module as described on page 43. 2. Click the SNMP tab (see Figure 18 on page 72). 3.
4. Enter the password. The HA Admin module opens, as shown in Figure 19. Figure 19 HA Admin module for the Core Switch 2/64 NOTE: There is a background color with the HA Status for each CP. The HA Admin module is not refreshed automatically. Click Refresh to update the information displayed in the HA Admin module. Synchronizing services on the CP A nondisruptive CP failover is possible only when all the services on it have been synchronized. To synchronize the services: 1.
When the HA Status field displays Non-Disruptive Failover Ready, a failover can be initiated without disrupting frame traffic on the fabric. Initiating a CP failover A nondisruptive failover might take a few minutes to complete. You may lose connection to the switch for a few minutes during the failover; however, Advanced Web Tools automatically resumes the connection after the failover. To initiate a CP failover: 1.
Figure 20 AAA Service tab Enabling and disabling RADIUS service At least one RADIUS server must be configured before you can enable RADIUS service. To enable or disable RADIUS service: 1. Launch the Switch Admin module as described on page 43. 2. Click the AAA Service tab. 3. To enable RADIUS service, select a RADIUS service from the Primary AAA Service list and then select None or Switch Database from the Secondary AAA Service list.
To configure the RADIUS server: 1. Launch the Switch Admin module as described on page 43. 2. Click the AAA Service tab. 3. Click Add. You can configure up to five RADIUS servers. If five RADIUS servers are already configured, the Add button is disabled. The RADIUS Configuration dialog box opens. 4. Enter the RADIUS server name, which is a valid IP address or Dynamic Name Server (DNS) string. Each RADIUS server must have a unique IP address or DNS name for the RADIUS server. 5.
Removing a RADIUS server Use the following procedure to remove a RADIUS server: 1. Launch the Switch Admin module as described on page 43. 2. Click the AAA Service tab. 3. Select a RADIUS server from the RADIUS Configuration list. 4. Click Remove. If there is no RADIUS server configured, the Remove button is disabled. You cannot remove the only RADIUS server if the RADIUS service is the primary AAA service. The RADIUS server is not deleted until you apply the changes from the AAA Services tab. 5.
4 Monitoring your fabrics, switches, and ports This chapter contains the following sections: • Monitoring events, page 79 • Displaying a fabric topology report, page 84 • Displaying the name server entries, page 85 • Displaying switch information, page 87 • Physically locating a switch using beaconing, page 90 • Displaying port information, page 90 • Displaying swapped port area IDs, page 92 Monitoring events Advanced Web Tools displays fabric-wide and switch-wide events.
Table 7 Event security levels Icon and level Description Critical (0) Critical-level messages indicate that the software has detected serious problems that will cause a partial or complete failure of a subsystem if not corrected immediately; a power supply failure or rise in temperature, for example, must receive immediate attention. Error (1) Error-level messages indicate a condition that does not significantly affect overall system functionality.
Figure 21 Fabric Events view Displaying switch events The Switch Events window displays a running log of events for the selected switch (see Figure 22). Switch events are polled and updated every 15 seconds, so there is no refresh-on-demand option for switch events as there is for the fabric events. NOTE: For two-switch configurations, all chassis-related events are displayed in the event list of each logical switch for convenience. Fabric OS 5.0.
Figure 22 Switch Events view To display switch events: 1. Click the switch from the Fabric Tree. The Switch View opens. 2. Click the Events button from the Switch View. The Switch Events window opens (see Figure 22). 3. Optional: Click the column head to sort the events by that column. Drag the column divider to resize a column. You can also filter switch events, as described in ”Filtering fabric and switch events”.
Figure 23 Event Filter dialog box To filter events by time intervals: 1. Launch the Fabric Events or Switch Events view as described in ”Displaying fabric events” on page 80 or ”Displaying switch events” on page 81. 2. Click Filter. The Event Filter dialog box opens. 3. To filter events within a certain time period: a. Select From and enter the start time and date in the fields. b. Select To and enter the finish time and date in the fields. 4.
3. Select Level. The event severity level check boxes are enabled. 4. Click the event levels you want to display. 5. Click OK. The filter is enabled and the enabled filter type is displayed in the events window. To filter events by message ID: 1. Launch the Fabric Events or Switch Events view as described in ”Displaying fabric events” on page 80 or ”Displaying switch events” on page 81. 2. Click Filter. The Event Filter dialog box opens. 3. Select Message ID. 4.
Figure 24 Fabric topology report Displaying the name server entries Advanced Web Tools displays Name Server entries listed in the Simple Name Server database (see Figure 25). This includes all Name Server entries for the fabric, not only those related to the local domain. Each row in the table represents a different device. NOTE: Name Server entries are not automatically polled by default. You must click Refresh from the Name Server view to poll Name Server entries.
Figure 25 Name Server view To view a list of the switches in the Name Server: 1. Click the Name Server icon from the Fabric Toolbar. The Name Server Table opens. 2. Optional: Click the Auto Refresh check box from the Name Server view. 3. Optional: Enter an autorefresh interval (in seconds), with a minimum of 15 seconds. The Name Server entries refresh at the rate you set. To print the Name Server entries: 1. Click the Name Server icon from the Fabric Toolbar. The Name Server Table opens. 2. Click Print.
3. Click Detail View. The Name Server Information dialog box opens and displays information specific to that device. To display the zone members of a particular device: 1. Click the Name Server icon from the Fabric Toolbar. The Name Server Table opens. 2. Select a device from the Domain column. 3. Click Accessible Devices. The Zone Accessible Devices view displays accessible zone member information specific to that device.
Displaying the power supply status The background color of the Power button indicates the overall status of the power supply. For more information regarding switch power modules, refer to the appropriate hardware documentation. To display the power supply status detail: 1. Select a switch from the Fabric Tree. The selected switch appears in the Switch View. The background color of the Power button indicates the overall status of the power supply. 2. Click the Power button from the Switch View.
The selected switch appears in the Switch View. The background color of the Status button indicates the overall status of the switch. 2. Click the Status button from the Switch View. The detailed switch health report is displayed, as shown in Figure 26. 3. Optional: Click the underlined links in the left panel to display detailed information about ports and Switch Availability Monitoring (SAM). 4.
Displaying detailed switch information The Info button in the Switch View displays detailed switch information, as shown in Figure 28. Figure 28 Switch information view To display detailed switch information: 1. Select a switch from the Fabric Tree. The selected switch appears in the Switch View. 2. Click the Info button . The Switch Information view is displayed. Physically locating a switch using beaconing Use the Beacon button to physically locate a switch in a fabric.
If the entire port icon is blue, the port is buffer-limited. If a group of port icons is grayed out, those ports are not licensed. The port status is also indicated in the Port Information screen in the Port Health field for the selected port. Figure 29 shows a port icon and associated LEDs from a Core Switch 2/64. Figure 29 Port and LED status color-coded information The Port Information screen displays statistics and status for the selected port, SFP, or loop, as shown in Figure 30.
1. Select a switch from the Fabric Tree. The selected switch appears in the Switch view. 2. Click the port icon for which you want to view information. The Port Information screen opens. 3. This step is switch-specific: For the Core Switch 2/64 and SAN Director 2/128, click the slot tab that corresponds to the correct slot for the logical switch. For the HP StorageWorks SAN Switch 2/8V, SAN Switch 2/16V, SAN Switch 2/32, and SAN Switch 4/32, proceed directly to the next step. 4. Click the port tab. 5.
5 Zone administration This chapter briefly describes zoning and provides the procedures for managing zoning using Advanced Web Tools.
Figure 31 Zone Admin module The information in the Zone Admin module is collected from the selected switch. If secure mode is enabled, zoning can be administered only from the primary FCS switch. If the selected switch has an Advanced Zoning license installed, but is not the primary FCS switch, the Zone Admin icon is displayed in the Fabric Toolbar but not activated. For specific information regarding secure fabrics, refer to the HP StorageWorks Secure Fabric OS user guide.
Figure 32 Device Detail view example NOTE: In the Device Detail view, the scroll bars in the Member of Zones and Member of Aliases sections do not scroll unless you double-click them first. The remainder of this section describes basic zoning procedures you can perform in the Zone Admin module that are useful for all zoning operations. Launching the Zone Admin module This section describes how to launch the Zone Admin module, from which all zoning procedures are performed.
Refreshing the Zone Admin module information The information displayed in the Zone Admin module is initially a snapshot of the contents of the fabric zoning database at the time the module is launched. Any changes you make to this view are saved to a local buffer; they are not applied to the fabric zoning database until you invoke one of the transactional operations listed in the Actions menu. Any local zoning changes are buffered by the Zone Admin module until explicitly saved to the fabric.
NOTE: If you made changes to a configuration, you must enable the configuration before the changes become effective. To enable the configuration, see ”Enabling a zone configuration” on page 106. Closing the Zone Admin module It is very important to remember that any changes you make in the Zone Admin module are not saved automatically. HP recommends that you always close the Zone Admin module from the File menu as described in the following procedure.
Managing zone aliases An alias is a logical group of port area numbers, WWNs, or AL_PAs. Specifying groups of ports or devices as an alias makes zone configuration easier, by enabling you to configure zones using an alias rather than specifying a long string of individual members.
Renaming a zone alias Use the following procedure to change the name of a zone alias: 1. Launch the Zone Admin module as described on page 95. 2. Click the Alias tab. 3. Select the alias you want to rename from the Name list. 4. Click Rename. The Rename an Alias dialog box opens. 5. Enter a new alias name and click OK. The alias is renamed in the Zone Admin buffer. Deleting a Zone Alias You can remove a zone alias from the Zone Admin buffer.
5. Enter a name for the new zone in the Create New Zone dialog box, and click OK. The new zone appears in the Name list. 6. Click + signs in the Member Selection List to view the nested elements. The choices available in the Member Selection List depend on the selection made in the View menu. 7. Select an element in the Member Selection List that you want to include in your zone. The Add Member button becomes active. 8. Click Add Member to add the zone member.
5. Click Yes. The selected zone is deleted from the Zone Admin buffer. Managing QuickLoops QuickLoop is an HP software product that allows multiple ports on a switch to create a logical loop. Devices connected via QuickLoop appear to each other as if they are on the same arbitrated loop. QuickLoop can be administered using Fabric OS v4.x versions; however, switches or directors running Fabric OS v4.x cannot be members of a QuickLoop.
NOTE: There is a limit of two members per QuickLoop. Only switches capable of running QuickLoop are displayed in the Member Selection List. 5. Click Add Member to add a QuickLoop member or click Remove Member to remove a QuickLoop member. Renaming a QuickLoop Use the following procedure to change the name of a QuickLoop: 1. Launch the Zone Admin module as described on page 95. 2. Click the QuickLoop tab. 3. Select the QuickLoop you want to rename from the Name list. 4. Click Rename.
2. Select View > Mixed Zoning. You can select any view except the AL_PA view. The Mixed View tab opens. 3. Click the Fabric Assist tab. 4. Click Create. The Create New FA dialog box opens. 5. Enter a name for the new FA zone and click OK. A fabric host is required. 6. Click the FA zone members from the Member Selection List. 7. Click Add Member. The new members appear in the Fabric Assist Members area. The newly created FA zone also appears in the Config tab.
The selected FA zone is deleted from the Zone Admin buffer. Managing zoning configurations A zone configuration is a group of zones. Zoning is enabled on a fabric by enabling a specific configuration. You can specify members of a configuration using the following methods: • Zone names • QuickLoop names • FA zone names Figure 33 shows a sample zoning database and the relationship among the zone aliases, zones, and zoning configuration.
2. Select a format to display zoning members in the Member Selection List as described in ”Zoning views” on page 97. 3. Click the Config tab. 4. Click Create. The Create New Config dialog box opens. 5. Enter a name for the new configuration and click OK. The new configuration appears in the Name list. 6. Click + signs in the Member Selection List to view the nested elements. The choices available in the list depend on the selection made in the View menu. 7.
NOTE: You cannot rename the currently enabled configuration. 1. Launch the Zone Admin module as described on page 95. 2. Click the Config tab. 3. Click the configuration you want to rename from the Name list. 4. Click Rename. The Rename a Config dialog box opens. 5. Enter a new configuration name and click OK. The configuration is renamed in the configuration database. 6. Select Actions > Save Config Only to save the configuration changes.
Disabling a zone configuration When you disable the active configuration, the Advanced Zoning feature is disabled on the fabric and all devices within the fabric can communicate with all other devices. This does not mean that the zoning database is deleted, however, only that there is no configuration active on the fabric. When you disable a zone configuration from Advanced Web Tools, keep in mind that the entire zoning database is automatically saved, and then the selected zone configuration is disabled.
1. Launch the Zone Admin module, as described on page 95. The zone configuration in effect at the time you launched the Zone Admin module is identified in the top right corner. This information is automatically updated every 15 seconds. It is also updated if you manually refresh the Zone Admin module contents by clicking the refresh icon at the bottom right corner of the Zone Admin module, or when you enable a configuration through the Zone Admin module.
Figure 35 Zone Configuration summary Creating a configuration analysis report The configuration analysis report lists the following: • SAN components (ports, WWNs, and AL_PAs) that are not included in the configuration • SAN components (ports, WWNs, and AL_PAs) that are contained in the configuration, but not in the fabric To create a configuration analysis report: 1. Launch the Zone Admin module as described on page 95. 2. Click the Config tab. 3. Select a configuration to be analyzed from the Name list.
4. Click Device Accessibility. The Initiator/Target Accessibility Matrix for Config- Device Selection dialog box opens. 5. Select devices you want displayed in the accessibility matrix; click the radio button to select all devices in the fabric or to select a subset of the devices. If you select a subset, you must click the devices from the Select Devices list and click Add to move them to the Evaluate for Accessibility list. 6. Click OK. The Initiator/Target Accessibility Matrix appears.
• Adding and removing members of a zone alias, page 98 Adding a WWN to multiple aliases, zones, and FA zones This procedure enables you to configure a WWN as a member in a zone configuration prior to adding that device to the fabric. It is useful if you want to add a WWN to all or most zoning entities. The added WWN does not need to currently exist in the fabric. To add a WWN to the Zone Admin buffer: 1. Launch the Zone Admin module as described on page 95. 2. Select Edit > Add WWN.
The Replace WWN dialog box lists all the zoning elements that include the WWN. 6. Click an item in the list to select or unselect, and then click Replace to replace the WWN in all the selected zoning elements. The former WWN is replaced in the Zone Admin buffer by the new WWN, including within any alias or zone in which the old WWN was a member. Searching for a zone member You can search zone member selection lists for specified strings of text.
Using zoning wizards The Zone Admin module contains the following wizards to help you perform zoning tasks: • Add Un-zoned Devices • Remove Offline Devices • Replace Offline Devices • Define Device Alias The wizards are accessed through the Tools menu in the Zone Admin module. The following sections describe the zoning tasks and the procedures for accessing the wizards for each task. The wizards are self-explanatory, so the specific steps are not documented here.
3. Follow the steps outlined in the wizard. The wizard displays unzoned devices and prompts you to select them and add them to an alias or a zone. When you have finished the steps for adding a device to a zone or alias, if there are any more unzoned devices, you can either continue to add them or exit the wizard. If there are no more unzoned devices, you must exit the wizard.
NOTE: To enter a zone alias name, double-click the Zone Alias field for each device, as shown in Figure 38, and enter the name. After entering each alias name, press Enter or click another zone alias field, or the wizard does not accept the name. Figure 38 Entering a zone alias in the Define Device Alias wizard Fabric OS 5.0.
Zone administration
6 Performance monitoring administration This chapter contains the following sections: • Monitoring performance using Advanced Web Tools, page 117 • Launching the Performance Monitor module, page 120 • Creating a basic Performance Monitor graph, page 120 • Customizing basic monitoring graphs, page 121 • Creating advanced performance monitoring graphs, page 123 • Managing performance graphs, page 126 Monitoring performance using Advanced Web Tools The Advanced Web Tools Performance Monitor module graphically
The Window menu also lists all open graphs. You can select a graph name from the Window menu to bring that graph to the front view when the graphs are cascaded, and to select the window for that graph when the graphs are tiled. Predefined performance graphs Advanced Web Tools predefines basic graph types to simplify performance monitoring. A wide range of end-to-end fabric, LUN, device, and port metrics graphs are included. Table 8 lists the basic monitoring graphs available.
Table 9 Advanced performance monitoring graphs Graph type Description SID/DID Performance Displays the traffic between the SID-DID pair on the switch being managed. For more information, see ”Creating an SID/DID performance graph” on page 123. SCSI vs. IP Traffic Displays percentage of SCSI versus IP frame traffic on each individual port. For more information, see ”Creating a SCSI vs. IP traffic graph” on page 124. AL_PA Errors Displays CRC errors for a given port and a given AL_PA.
User-defined graphs You can modify the predefined graphs to create your own customized graphs (see ”Customizing basic monitoring graphs” on page 121 for more information). These user-defined graphs can be added and saved to canvas configurations, as described on page 126. Canvas configurations A canvas is a saved configuration of graphs. The graphs can be either the Advanced Web Tools predefined graphs or user-defined graphs. Each canvas can hold up to eight graphs per window, as shown in Figure 40.
2. Select Performance Graphs > Basic Monitoring > Graph Type. Depending on the type of graph you select, you may be prompted to select a slot or port for which to create a graph (see Figure 41). Figure 41 Creating a port throughput graph 3. If prompted, drag the port into the Enter/drag slot,port field, or manually enter the slot and port information in the field, in the format slot,port. For the Core Switch 2/64 and the SAN Director 2/128, you must select first a slot number and then a port number.
3. To display detailed port throughput utilization rates for particular ports only: a. Right-click anywhere in the graph. b. Select Select Ports. The setup dialog box opens (Figure 42). The title of the dialog box varies, depending on the type of graph you are customizing, but the layout of the dialog box is the same. Figure 42 shows an example of the setup dialog box for the Switch Throughput Utilization graph. Figure 42 Switch Throughput Utilization setup dialog box c.
Creating advanced performance monitoring graphs You can create the advanced performance monitor graphs listed in Table 9. Because the procedure for creating these graphs differs depending on the type of graph, each type is described separately in the sections that follow. NOTE: You must have an Advanced Performance Monitoring license installed to use the Advance Performance Monitor features.
The current end-to-end monitors for that port are displayed in the Current EE monitors set for selected port table. c. Optional: To display a performance graph for the current EE monitors set for the selected port, click an SID-DID pair in the table. You can select multiple Source ID and Destination IDs. Click Select. If you selected multiple SID/DID monitors, click OK in the confirmation dialog box that opens. Skip to step 6.
The applicable setup dialog box opens. Figure 44 shows the SCSI Read/Write on a LUN per port Setup dialog box. Figure 44 Creating a SCSI command graph 3. Navigate to a switch > slot > port in the Slot/Port Selection List. 4. Click the port from the Slot/Port Selection List and drag it into the Enter/drag slot,port field. 5. Optional: For the LUN per port graphs, type a LUN number in hexadecimal. For the SAN Switch 4/32, you can enter up to eight LUN masks. For all other switches running Fabric OS v4.
3. Navigate to a switch > slot > port in the Slot/Port or Alpa Selection List. 4. Click the port from the Slot/Port Selection List or an AL_PA from the Slot/Port Selection List, and drag it into the Enter/drag slot,port field. You can also manually type the slot and port number, in the format slot,port. 5. Click OK. The AL_PA error graph appears on the canvas.
The graphs are displayed in the in the Performance Monitor window. 3. Select File > Save Current Canvas Configuration. The Save Canvas Configuration dialog box opens. 4. Type a name and description for the configuration and then click Save Canvas. A message appears, confirming that the configuration was successfully saved to the switch. Printing graphs You can print a single graph or all the graphs displayed on the selected canvas configuration. Only one canvas configuration can be opened at a time.
6. Click OK to close the Edit dialog box. 7. Click Save to save the changes and close the Performance Monitor Canvas dialog box. 8. Click Close to close the Canvas Configuration List.
7 Fabric Watch administration This chapter contains the following sections: • Introduction to Fabric Watch, page 129 • Using Fabric Watch with Advanced Web Tools, page 129 • Configuring Fabric Watch thresholds, page 131 • Configuring alarms for FRUs, page 134 • Displaying Fabric Watch alarm information, page 134 • Configuring e-mail notifications, page 135 Introduction to Fabric Watch Fabric Watch is an HP optional software application that monitors the performance and status of switches and can automatica
Fabric Watch navigation tree, lists the available classes for the switch Summary of actions The last time the Fabric Watch module was updated Figure 46 Fabric Watch module The Fabric Watch navigation tree, on the left side of the module, displays the available classes. The classes are organized in a set of folders. Not all classes are available for all switches. Use the Fabric Watch module if you want to: • Configure custom threshold values on specific elements.
NOTE: The Watch button displays in the Switch View only if the Fabric Watch license has been activated. The login dialog box opens. 3. Enter the user name of an account with the admin role. 4. Enter the password. The Fabric Watch module opens (see Figure 46). Configuring Fabric Watch thresholds The Threshold Configuration tab enables you to configure event conditions. From this tab, you configure threshold traits, alarms, and e-mail configuration.
Figure 47 Threshold configuration for Fabric Watch 3. Click the Trait Configuration subtab. 4. Select a class from the Fabric Watch navigation tree. NOTE: If you select the FRU class from the Fabric Watch navigation tree, there is a separate set of instructions. See ”Configuring alarms for FRUs” on page 134. 5. Select an area from the Area Selection menu in the Threshold Configuration tab. The module displays two columns of trait information, labeled System Default and Custom Defined.
1. Launch the Fabric Watch module as described in ”To launch the Fabric Watch module:” on page 130. 2. Click the Threshold Configuration tab. 3. Click the Alarm Configuration subtab. 4. Click a class from the Fabric Watch navigation tree. 5. Select an area from the Area Selection menu in the Threshold Configuration tab. The module displays two tables of alarm configuration information, labeled System Default and Custom Defined. You cannot modify the information in the System Default table. 6.
Configuring alarms for FRUs Configuration for the FRU class is different from configuration for the other classes. Because FRUs are not monitored through a threshold-based system, they have a simpler interface for configuration. For FRUs, you configure the states for which an event occurs, as described in the following procedure. To configure alarms for FRUs: 1. Launch the Fabric Watch module as described in ”To launch the Fabric Watch module:” on page 130. 2. Click the Threshold Configuration tab. 3.
This tab displays a report of the configuration for the selected area. Displaying alarms Using the Alarm Notification tab, you can view a list of all alarms that have occurred for a selected class/area (see Figure 46 on page 130). Table 10 describes the columns in this report. (Note that for the FRU class, only the Name, State, and Time columns are displayed. In addition, if the FRU area is Fan, the Name column refers to either a fan or a fan FRU, depending on the switch model.
2. Click the Switch tab. 3. Enter your primary domain Name Server IP address in the DNS Server 1 field in the Email Configuration area (see Figure 48). 4. Enter your secondary domain server IP address in the DNS Server 2 field. 5. Enter the domain name in the Domain Name field (between 4 and 32 characters). 6. Click Apply to save the changes. Configuring the e-mail alert recipient You can set a different e-mail alert configuration for each class.
NOTE: E-mail addresses may not exceed 128 characters. 5. Click Apply. 6. Optional: Click Send Test Email to receive a test e-mail so you can verify the e-mail notification is working correctly. You can send a test e-mail only after you have applied your settings. Fabric OS 5.0.
Fabric Watch administration
8 Issues and workarounds This chapter provides the following information: • General Advanced Web Tools issues and workarounds, page 140 • Platform-specific issues and workarounds, page 145 • Mozilla browser issues and workarounds, page 145 Fabric OS 5.0.
General Advanced Web Tools issues and workarounds Table 11 lists issues and workarounds that apply to all browsers and switch platforms. Table 11 Advanced Web Tools issues and workarounds Issue Details Browser The Fabric Watch, Switch Admin, HA, Name Server, and Zone Admin modules are separate applets embedded in HTML pages. The successful launch of the applet depends on whether the browser can successfully load the HTML page.
Table 11 Advanced Web Tools issues and workarounds (continued) Issue Details Firmware download There are multiple phases to firmware download and activation. When Advanced Web Tools reports that firmware download has completed successfully, it indicates that a basic sanity check, package retrieval, package unloading, and verification was successful. Advanced Web Tools forces a full package install. To perform an incremental upgrade, use the Fabric OS CLI.
Table 11 Advanced Web Tools issues and workarounds (continued) Issue Details Java Plug-in When there is a dialog box opened for a module (for example, Switch Admin, Zone Admin, or Fabric Watch) and you try to open another module, the initial login dialog box receives an error and closes. This is a known defect in the Java 1.3.1_04 Plug-in and is documented in Bug Id 4763605 (available from www.java.sun.com). Workaround: Close and reopen the module.
Table 11 Advanced Web Tools issues and workarounds (continued) Issue Details Performance Monitor If the Web browser crashes or the Performance Monitor license is lost while the Performance Monitor module is running, some of the Performance Monitor resources owned by Advanced Web Tools may not be cleaned up correctly. Workaround: You may need to use the CLI to manually delete these counters.
Table 11 Advanced Web Tools issues and workarounds (continued) Issue Details Refresh option in browsers Following a switch enable or disable, you must wait at least 25–30 seconds for the fabric to reconfigure and for FSPF route calculations to complete before requesting routing information. If access too early, routing information is not shown. Workaround: Following a switch enable or disable, wait at least 25–30 seconds before further action.
Platform-specific issues and workarounds Table 12 lists Advanced Web Tools issues specific to the Core Switch 2/64 and the SAN Director 2/128 when they are configured to have two domains. Table 12 Platform-specific issues and workarounds Issue Details Switch View Neither CP is updated in the Switch View (see Figure 1 on page 25) when switch 0 is being rebooted. The CP data displayed on this Switch View is dependent on switch 0, and that data is not available when switch 0 is rebooting.
Table 13 Advanced Web Tools issues when using the Mozilla browser Issue Details Mozilla Browser on Red Hat Operating System On the Red Hat platform, the default system font size is larger than on other platforms. This can cause tabbed panes to not line up. There is no impact on functionality.
Glossary This glossary defines terms used in this guide or related to this product and is not a comprehensive glossary of computer terms. address identifier A 24-bit or 8-bit value that identifies the source or destination of a frame. See also SID and DID. AL_PA Arbitrated-loop physical address. A unique 8-bit value assigned during loop initialization to a port in an arbitrated loop. Also called arbitrated-loop parameters. alias A logical grouping of elements in a fabric.
configuration 1. A set of parameters that can be modified to fine-tune the operation of a switch. Use the configshow command to view the current configuration of your switch. 2. In HP Zoning, a zoning element that contains a set of zones. The configuration is the highest-level zoning element and is used to enable or disable a set of zones on the fabric. See also zone configuration. core PID Core switch port identifier. The core PID must be set for v3.1 and earlier switches included in a fabric of v4.
fabric services Codes that describe the communication to and from any well-known address. fabric topology The arrangement of switches that form a fabric. FC-4 Layer of Fibre Channel transport that handles standards and profiles for mapping upper-level protocols such as SCSI and IP onto the Fibre Channel Protocol. FC-GS-3 Fibre Channel Generic Services, third generation. FCIP Fibre Channel over IP. FC-NAT Fibre Channel network address translation.
Fx_Port A fabric port that can operate as either an F_Port or FL_Port. See also FL_Port. G_Port Generic port. A port that can operate as either an E_Port or an F_Port. A port is defined as a G_Port when it is not yet connected or has not yet assumed a specific function in the fabric. gateway Hardware that connects incompatible networks by providing translation for both hardware and software. For example, an ATM gateway can be used to connect a Fibre Channel link to an ATM connection.
LSAN zone The mechanism by which LSANs are administered. An MP Router attached to two fabrics listen for the creation of matching LSAN zones on both fabrics. If detected, it creates phantom domains and FC-NAT entries as appropriate, and insert entries for them into the name servers on the fabrics. LSAN zones are compatible with all standard zoning mechanisms. Mbps Megabits per second.
PID Port identifier. See also core PID. point-to-point A Fibre Channel topology that employs direct links between each pair of communicating entities. See also topology. port In an HP StorageWorks switch environment, an SFP or GBIC receptacle on a switch to which an optic cable for another device is attached. port address In Fibre Channel technology, the port address is defined in hexadecimal.
server A computer that processes end-user applications or requests. SFP Small-form-factor pluggable. A transceiver used on 2 GBps switches that replaces the GBIC. simple name server A switch service that stores names, addresses, and attributes for up to 15 minutes and (SNS) provides them as required to other devices in the fabric. SNS is defined by Fibre Channel standards and exists at a well-known address. Also called directory service or name server. SNMP Simple Network Management Protocol.
WWN World Wide Name. An identifier that is unique worldwide. Each entity in a fabric has a separate WWN. xlate domain Translate domain. A router virtual domain that represents an entire fabric. Device connectivity can be achieved from one fabric to another, over the router and through this virtual domain, without merging the two fabrics. Also known as a phantom domain. zone A set of devices and hosts attached to the same fabric and configured as being in the same zone.
Index A accessing Switch Admin module 43 switch event report 81 telnet window 43 activating licenses 63 adding performance graphs to a canvas 126 unzoned online devices to zones 113 WWN to zoning database 111 AL_PA error graphs 125 AL_PA zoning 97 alarm configuration report 134 alarms configuring 132, 134 displaying 135 enabling and disabling 133 alias, description 98 assigning a name to a port 53 authorized reseller, HP 11 automatic trace dump transfers 67 B backing up configuration file 61 basic performa
QuickLoops 102 user accounts 70 WWN from zoning database 111 zone aliases 99 zones 100 zoning configurations 106 device aliases, defining 114 device probing 49 device-based routing 19, 57 disabling automatic trace uploads 68 dynamic load sharing 59 ports 53 RADIUS service 76 switch 46 telnet access 33 threshold alarms 133 trunking mode 65 zoning 107 zoning configurations 107 displaying alarms 135 enabled zoning configuration 107 fabric events 80 fan status 87 Name Server entries 85 port information 90 power
J Java Plug-ins, supported 35 Java, installing 36 JRE, installing 36 L launching Fabric Watch module 130 Hi Avail module 73 Performance Monitor module 120 Switch Admin module 43 telnet window 43 Zone Admin module 95 launching Web Tools 24 license ID, displaying 47, 90 license key 37 licenseadd 37 licensed features 62 licenses activating 63 installing Web Tools 37 removing 64 licenseshow 37 limited switch license 39 link cost 60 long distance connection, configuring 56 M managing RADIUS server 75 message s
replacing offline devices in zones 114 WWN in zoning database 111 requirements switch 39 Web Tools 35 restoring configuration file 62 routes configuring 57 static routes 58 S saving performance graphs 126 zoning changes 96 SCSI command graph 124 SCSI vs.
zones adding unzoned online devices 113 adding WWNs 111 creating 99 deleting 100 modifying 100 removing WWNs 111 renaming 100 replacing offline devices 114 replacing WWNs 111 zoning configurations creating 104 deleting 106 disabling 107 enabling 106 modifying 105 renaming 105 zoning database clearing 112 managing 110 removing offline devices 114 zoning method 97 zoning views 97 zoning, disabling 107 zoning, saving changes 96 Fabric OS 5.0.
Index