
Brocade Web Tools Administrator's Guide - Supporting Fabric OS v5.3.0 (53-1000435-01, June 2007)


134 Web Tools Administrator’s Guide
Publication Number: 53-1000435-01
Managing performance graphs
9
To print all graphs in a canvas
1. Open the Performance Monitoring window.
2. Click File> Print All Graphs.
3. In the print dialog box, click OK.
MODIFYING GRAPHS
Use the following procedure to modify an existing graph that is saved in a canvas.
To modify an existing graph
1. Open the Performance Monitoring window.
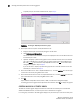
2. Click File> Display Canvas Configurations.
The Canvas Configuration List displays. A message “No Canvas configuration to display”
displays if there are no saved canvas configurations.
3. Select a canvas from the list and click Edit.
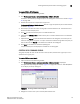
The Performance Monitor Canvas: Canvas Name dialog box displays.
4. Select a graph from the list and click Edit.
NOTE
The Edit button is enabled only for the graphs that are configurable or editable.
5. Make changes in the Edit dialog box, as necessary.
6. Click OK to close the Edit dialog box.
7. Cli ck Save to save the changes and close the Performance Monitor Canvas dialog box.
8. Click Close to close the Canvas Configuration List.